
Figure 2: Transcriptome analyses of wound epidermis and dermis between mice and rats.
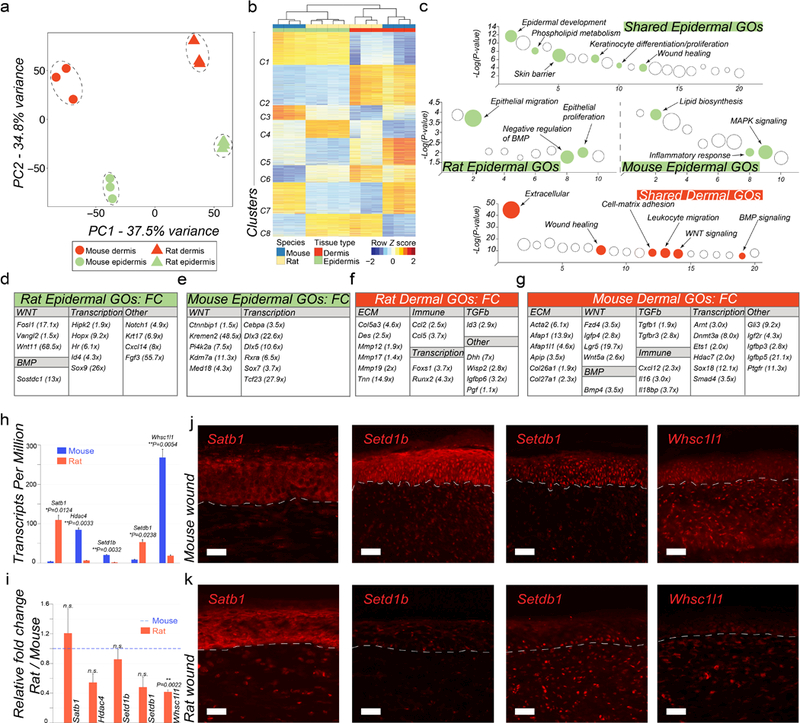
(a) Principal Component Analysis (PCA) reveals distinct separation between tissue types (wound epidermis and dermis) and between species (mouse vs. rat wound tissues). (b) Heat map representing 3,850 differentially expressed one-to-one gene orthologs between mouse and rat wound tissues grouped into eight different clusters. (c) Pathway analysis on gene clusters #1 (shared epidermal genes), #2 (shared dermal genes), #3 (mouse-specific epidermal genes) and #4 (rat-specific epidermal genes). Select pathways are marked (see Table S10) (d, e) Display of rat and mouse gene orthologs upregulated in wound epidermis. (f, g) Display of rat and mouse gene orthologs upregulated in wound dermis. (h) Rat and mouse TPM values for select epigenetic factors from RNA-seq (see Table S9). (i) qRT-PCR validation of select differentially expressed epigenetic factors between rat and mouse wound epidermis, including Satb1, Hdac4, Setd1b, Setdb1 and Whsc1l1. (j, k) Immunostaining of mouse (j) and rat wounds (k) at the time of scab detachment for select epigenetic factors: Satb1, Setd1b, Setdb1 and Whsc1l1. See Text S1 for detailed description of the observed expression pattern in wounds. Differential gene ortholog expression identification was performed at 5% FDR level and minimum 4X-fold change. Values in the graphs on 2h and 2i are means ± S.E.M. Two-tailed paired t-test in 2h, *P=0.0124 for Satb1, **P=0.0033 for Hdac4, **P=0.0032 for Setd1b, *P=0.0238 for Setdb1, **P=0.0054 for Whsc1l1; and in 2i, **P=0.0022. Size bars: j, k – 25 µm.