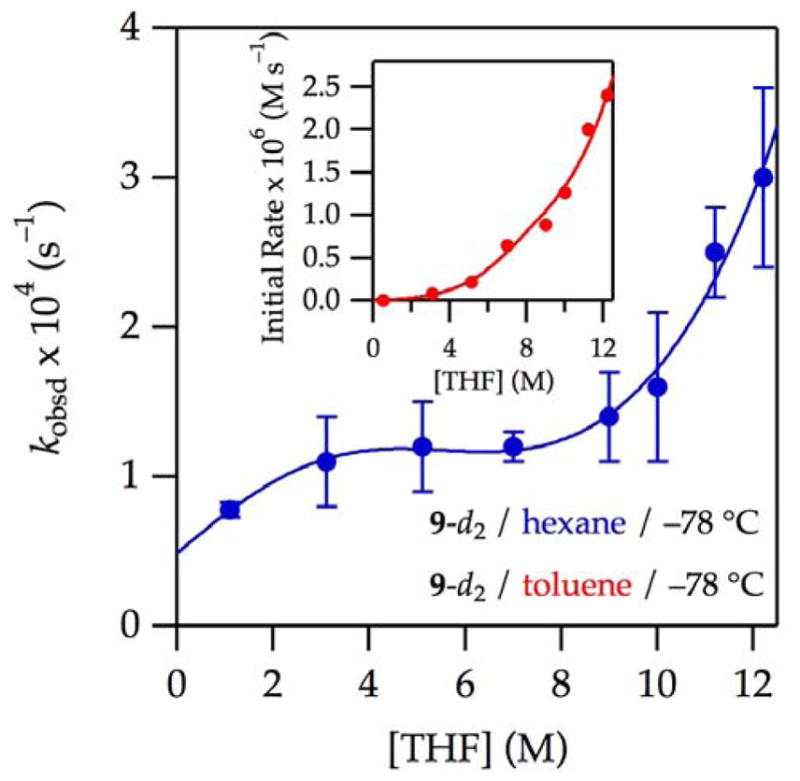
Figure 2.

Plot of kobsd vs THF concentration for the enolization of 0.0050 M oxazolidinone 9-d2 with 0.10 M LiHMDS with THF in hexane or toluene cosolvent at −78 °C. The curves depict unweighted least-squares fits to the model described by eq 12 (vide infra).
 (hexane): [A]0 is set at 0.10 M; Keq = (1.1 ± 1) × 10−4; k8 = (5 ± 4) × 10−4; k9 = (8 ± 20) × 10−9; k10 = (2.2 ± 1) × 10−4; k11 = (7 ± 3) × 10−11.
 (toluene) measured using initial rates: All parameters carried over from the fit from curve A; additionally, a = (−2 ± 1) × 10−4; b = (1.4 ± 0.9) × 10−4; c = 1.58 ± 0.06; and m = 5.
