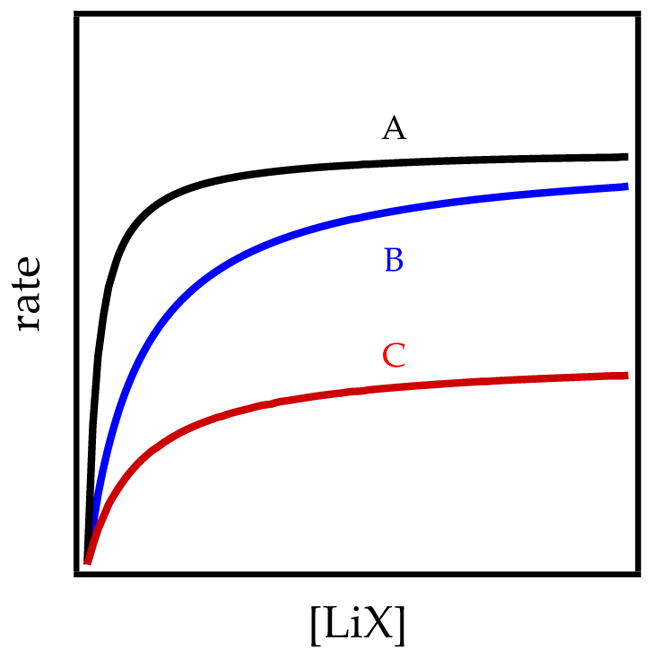
Figure 10.

Saturation behavior for LiX catalysts. Curve A is a strong catalyst, curve B is a weak catalyst, and curve C corresponds to catalysis of a different deaggregation step than those of curves A and B.

Saturation behavior for LiX catalysts. Curve A is a strong catalyst, curve B is a weak catalyst, and curve C corresponds to catalysis of a different deaggregation step than those of curves A and B.