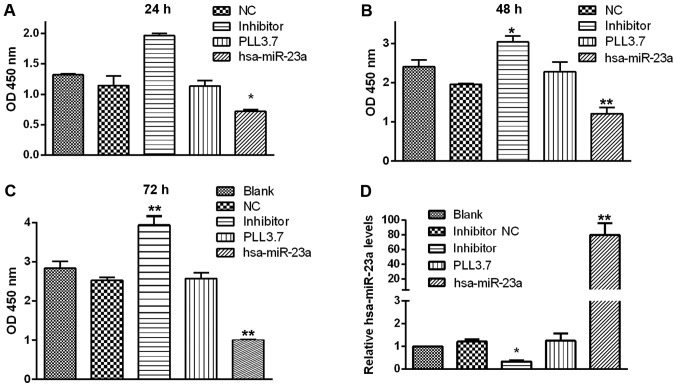
Figure 3.
Effects of miR-23a on pancreatic cancer cell proliferaton. The cell growth rates of each group was calculated at (A) 24, (B) 48 and (C) 72 h. (D) Relative has-miR-23a expression of the different groups was detected by reverse transcription-quantitative polymerase chain reaction analysis. Data were presented as the mean ± standard deviation. *P<0.05 and **P<0.01 vs. the blank group. NC, negative control; miR, microRNA; OD, optical density.

