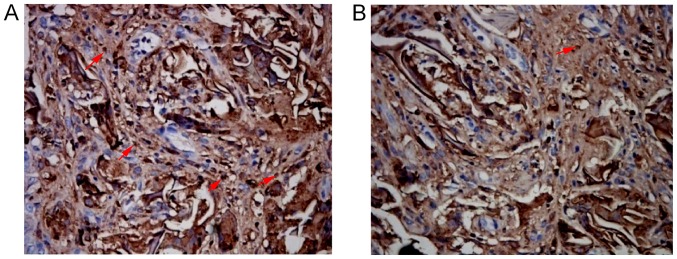
Figure 3.
Distribution of macrophages in (A) the SF group and (B) the SSF group 4 weeks following surgery. (A) Cells within the cytoplasm stained a brownish yellow were positive for macrophages; (B) the number of positive macrophages in the SSF group was lower than that of the SF group. Positive macrophages are indicated by red arrows (magnification, ×400). SF, silk fibroin; SSF, bromodeoxyuridine-labeled adipose mesenchymal stem cells-SF group.

