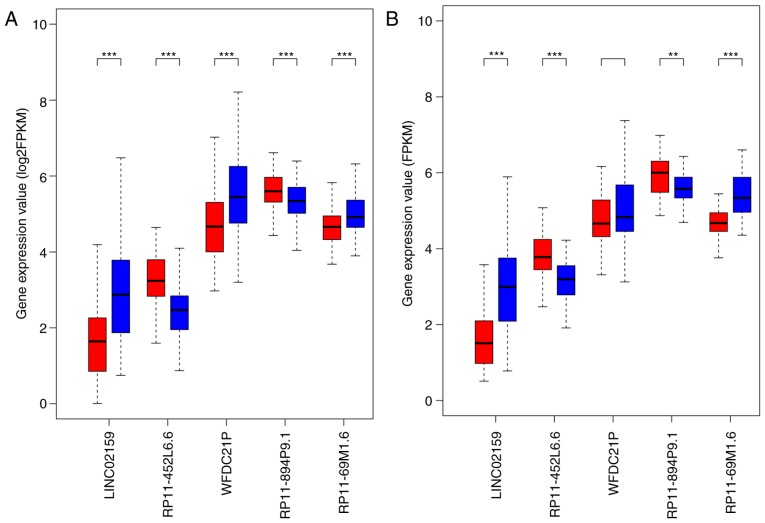
Figure 2.
Comparison of the expression of 5 lncRNAs between high- and low-risk groups in the (A) training set and the (B) testing set. Patients in the training set and the testing set were classified into low-risk and high-risk groups. Red boxplots represent expression of lncRNAs in the high-risk group; blue boxplots represent expression of lncRNAs in the low-risk group. ***P<0.001 and **P<0.01. FPKM, Fragments Per Kilobase of transcript per Million mapped read; LINC02159, long intergenic nonprotein coding RNA 2159; lncRNA, long noncoding RNA; WFDC21P, whey acidic protein four-disulfide core domain 21.

