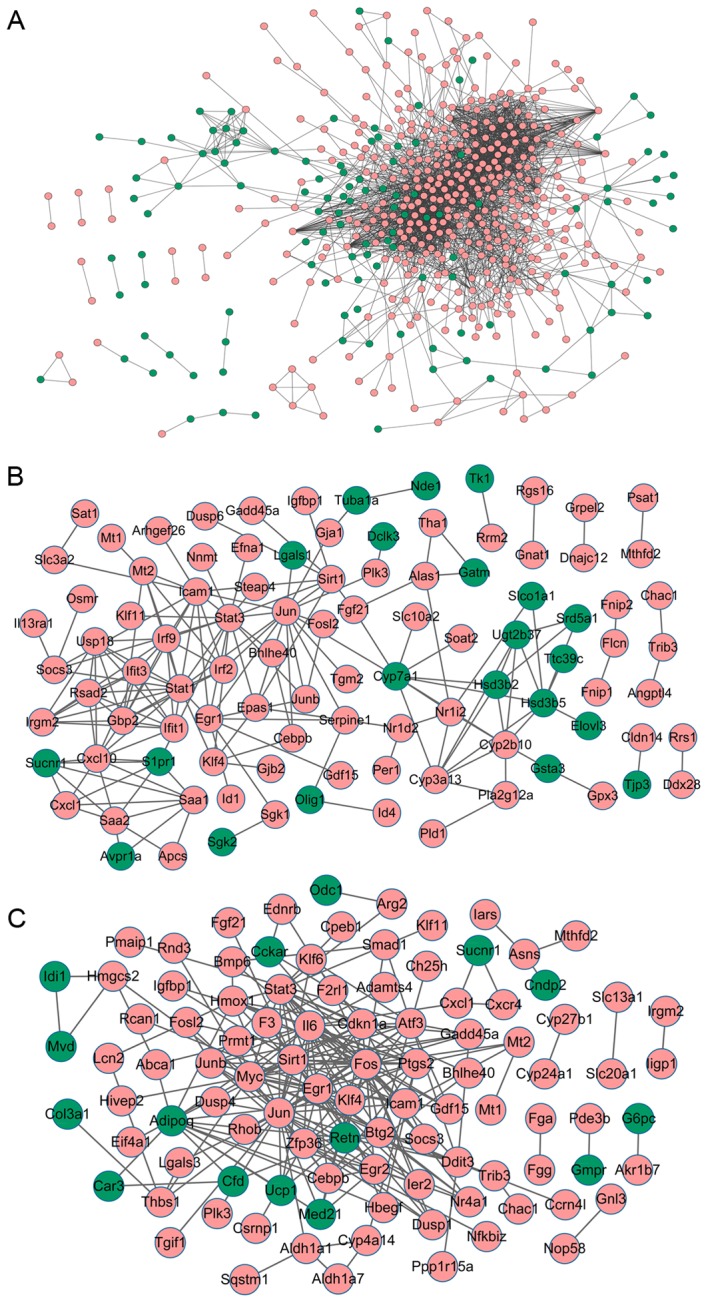
Figure 3.

Protein-protein interaction network of DEGs compared with the healthy controls. The network of DEGs in (A) lung (B) liver and (C) kidney samples from mice with multiple organ dysfunction syndrome. Pink nodes represent upregulated genes and green nodes represent the downregulated genes. DEGs, differentially expressed genes.
