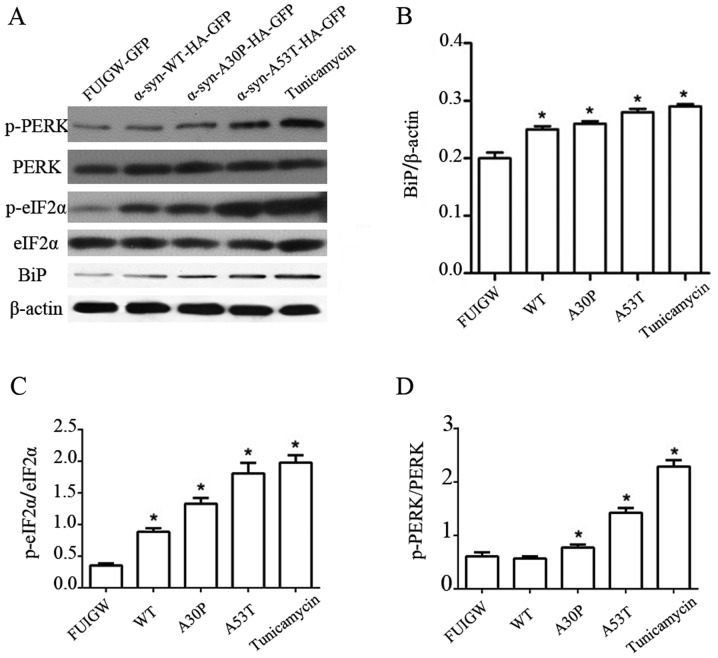
Figure 2.
Induction of UPR and PERK pathway in astrocytes overexpressing α-syn. (A) Western blot analysis of astrocytes 7 days following infection with lentiviral vectors expressing α-syn-WT-HA-FUIGW-GFP, α-syn-A53T-HA-FUIGW-GFP, α-syn-A30P-HA-FUIGW-GFP and the negative control FUIGW-GFP. Protein levels of Bip, total PERK, phosphorylated PERK, total eIF2α and phosphorylated eIF2α were determined by western blot analyses. β-actin blotting was used as a loading control. (B) Integrated density values for BiP relative to β-actin. (C) Integrated density values for phosphorylated eIF2α relative to total eIF2α. (D) Integrated density values for phosphorylated PERK relative to total PERK. The bars represent the mean ± standard deviation. *P<0.05 vs. FUIGW (negative control). α-syn, α-synuclein; WT, wild-type; HA, influenza A hemagglutinin; GFAP, glial fibrillary acidic protein; GFP, green fluorescence protein; UPR, unfolded protein response; PERK, protein kinase RNA-like endoplasmic reticulum kinase; Bip, binding immunoglobulin heavy chain protein; p-, phosphorylated; eIF2α, eukaryotic translation initiation factor 2α.

