

Abstract
Rheumatoid arthritis (RA) is an autoimmune disease, which is characterized by inflammatory synovitis, and the subsequent destruction of articular cartilage and bone. Sinomenine is a traditional Chinese medicine, which has been employed as a clinical treatment for RA for several years in China. The present study investigated the anti-arthritic effects of sinomenine on Sprague-Dawley rats with collagen-induced arthritis (CIA). The differentially expressed proteins in serum were measured by proteomic analysis in order to generate a differentially expressed protein network. A total of 320 differentially expressed proteins were detected in the drug-treated group compared with in the control group. In the sinomenine-treated group, 79 differentially expressed proteins were detected compared with in the model group, and among these, 46 proteins were upregulated. Gene ontology analysis revealed that five functions were affected by sinomenine treatment of CIA rats compared with in the model group. In addition, Ingenuity® Pathway Analysis was used to measure enriched signaling pathways, which revealed nuclear factor-κB, histones, heat shock proteins and protein kinase B as core proteins, generating ~60 pair associations in the network. To the best of our knowledge, the present study is the first to perform proteomic analysis in sinomenine-treated CIA rats, and the results revealed that numerous targets were involved in the process. In addition, the present study provided a novel approach and evidence for exploring the biological effects of sinomenine. Therefore, the findings of the present study may provide a novel insight into the anti-RA mechanisms of sinomenine, and may justify further exploration into its function in other relevant diseases.
Keywords: sinomenine, rheumatoid arthritis, collagen-induced arthritis, proteome
Introduction
Rheumatoid arthritis (RA) is primarily characterized by inflammatory synovitis, with subsequent destruction of articular cartilage and bone, joint swelling and space narrowing, and joint stiffness, deformity and dysfunction (1,2). RA is an autoimmune disease, and the pathological features mostly affect multiple small symmetrical joints of the hands and feet (1). The current therapeutic strategies available for RA include nonsteroidal anti-inflammatory drugs (NSAIDs), disease modifying anti-rheumatic drugs, glucocorticoids and surgery (3). Sinomenine is a bioactive alkaloid, which is extracted from the stems and roots of the Chinese medicine Sinomenium acutum. Sinomenine exerts various pharmacological activities, including anti-arthritic, immunosuppressive, neuroprotective, anti-inflammatory and anticancer effects (4–6). Sinomenine is widely used as a traditional Chinese medicine in the treatment of RA, as it exerts a biological effect on immunoregulation, anti-inflammation and bone protection (7,8). In addition, sinomenine is effective in ameliorating morning joint stiffness and painful joints, and exhibits fewer side effects on the digestive system compared with NSAIDs (9). Since sinomenine exerts immunosuppressive and anti-inflammatory effects, it is widely used to treat RA in Chinese clinical practice (10).
The proteome is an entire set of proteins encoded by the full genome produced by an organism or system. In addition, the proteome is the subject to sorting N-terminal peptides, which may be identified and quantified by mass spectrometrometry (MS) (11–13). In recent years, proteome analysis has been employed to enhance understanding of malignant tumors and malaria (14,15). However, the association between RA and the serum proteome requires further analysis. The mechanisms underlying the development of RA are complex and are not fully understood. Few studies have focused on the association between RA and the serum proteome (16–18); therefore, the present study performed proteomic analysis to detect the anti-RA mechanisms of sinomenine.
The pathological features of collagen-induced arthritis (CIA) in rats are consistent with typical pathological alterations in patients with RA; therefore, CIA is the most widely studied CIA model in preclinical studies (19). The present study demonstrated that sinomenine exerted anti-inflammatory effects, and alleviated the hyperplasia of fibrous tissue to exert an anti-arthritic effect. In addition, the present study investigated serum proteome profiles in the blank control group, model group, test group and positive control group, in order to generate a differentially expressed protein network map and evaluate the effectiveness of sinomenine in RA via multitarget methods.
Materials and methods
Animals
A total of 60 Sprague-Dawley female rats (aged 6–8 weeks old; 190–200 g) were purchased from the Laboratory Animal Research Center of Nanjing University of Chinese Medicine (Nanjing, China). All rats were housed at 26°C under pathogen-free conditions with a 12 h light/dark cycle and a 60% humidity, and fed with standard rat chow and water ad libitum. All experiments were conducted in compliance with the guidelines for the Care and Use of Laboratory Animals (20), and the present study was approved by the Institutional Animal Care and Use Committee of Nanjing University of Chinese Medicine. Rats were divided into six groups (10 rats per group), five of which underwent CIA.
Assessment of CIA in rats
The CIA model was established according to a previously described protocol (19). Briefly, 8 mg type II collagen (CII) (Chondrex, Redmond, WA, USA) was dissolved in 0.1 mol/l acetic acid and vortexed at 4°C; the concentration of CII reached 2 mg/ml. A total of 100 µg CII was emulsified thoroughly with the same volume of complete Freund's adjuvant (Chondrex) in an ice bath; the final concentration of CII reached 1 mg/ml. A total of 50 rats were injected subcutaneously at the tail base with 200 µl CII emulsion for the first immunization. After 7 days, 100 µg CII was dissolved and emulsified at the same concentration using incomplete Freund's adjuvant (Chondrex), and 100 µl emulsion was subcutaneously administered into the tail as a booster injection. Clinical arthritis was measured and the Arthritis Index (AI) was analyzed, as presented in Table I. The AI for each rat was expressed as the sum of the scores for all four limbs; therefore, the maximum AI was 16.
Table I.
Scoring system for the evaluation of arthritis severity.
| Severity score | Degree of inflammation in the joints |
|---|---|
| 0 | No evidence of erythema and swelling |
| 1 | Erythema and mild swelling confined to the tarsals or ankle joint |
| 2 | Erythema and mild swelling extending from the ankle to the tarsals |
| 3 | Erythema and moderate swelling extending from the ankle to metatarsal joints |
| 4 | Erythema and severe swelling encompass the ankle, foot and digits, or ankylosis of the limb |
In vivo drug administration
CIA rats were randomly separated into the model control group, low dose group (sinomenine 30 mg/kg/day), middle dose group (sinomenine 60 mg/kg/day), high dose group (sinomenine 120 mg/kg/day) and positive control group (methotrexate 0.5 mg/kg/day). Sinomenine (cat no. Z20010174; Hunan Zhengqing Pharmaceutical, Hunan, China) was dissolved in normal saline at various concentrations and administered every day. Methotrexate (cat no. H31020644; Shanghai SINE Pharmaceutical Co., Ltd., Shanghai, China) was dissolved and 0.5 mg/kg/day methotrexate was administered every 3 days by gavage. The model group and blank control group were administered saline (1 ml/100 g) by gavage. The drug was administered continuously for 28 days.
Rheumatoid serum biochemical measurements
After treatment, rats were anesthetized with 5% isoflurane, and blood samples (3 ml) were obtained from the abdominal aorta, after which the rats were sacrificed. The blood samples were centrifuged at 3,000 × g for 10 min at 4°C. Serum was isolated for measurement of rheumatoid factor (RF) and C-reactive protein (CRP), according to the manufacturer's protocols (Abcam, Cambridge, UK; cat nos. ab178653 and ab108827).
Measurement of alanine aminotransferase (ALT) and aspartate aminotransferase (AST)
AST assay kit (GOT kit; cat no. C010-2) and ALT assay kit (GPT kit; cat no. C009-2) were purchased from Nanjing Jiancheng Bioengineering Institute (Nanjing, China). ALT and AST activity were measured after 6 weeks according to the manufacturer's protocols.
Histological scoring
Rats were euthanized using CO2 (displacement rate of the chamber volume/min, 10%), and the paw and knee joints of rats were fixed in 10% paraformaldehyde for 1 h at room temperature, decalcified in EDTA, embedded in paraffin and then sectioned (size, 4 µm). Tissue sections were mounted on slides for staining with hematoxylin and eosin for 1 h at room temperature. All sections were randomized and evaluated by two trained observers who were blinded to the treatment groups and the arthritis severity of each rat. The data were expressed as mean inflammation score and all scores were based on a scale of 0–5 (Table II). For each section, the number of positively stained cells was counted in 20 fields using a phase contrast microscope (magnification, ×200).
Table II.
Scoring system for the evaluation of histology.
| Score | Degree of histological scoring |
|---|---|
| 0 | No staining |
| 1 | Few of the cells were positively stained |
| 2 | Some (<50%) of the cells were stained |
| 3 | ~50% of the cells were stained |
| 4 | >50% of the cells were stained |
| 5 | All cells stained |
Serum sample processing
After treatment, rats were anesthetized with 5% isoflurane, and blood samples were obtained from the abdominal aorta and transferred to a 1.5 ml Eppendorf protein tube (Eppendorf, Hamburg, Germany). The blood samples were briefly vortexed and incubated at 4°C for 6 h to precipitate serum proteins. Subsequently, the samples were centrifuged at 1,000 × g for 10 min at 4°C. The collected supernatants were then centrifuged at 16,000 × g for 10 min at 4°C to remove lipids and the clearest serum was collected and centrifuged 4,000 × g at 4°C for 10 min to remove any remaining cells. The extracted serum was transferred to a 200 µl Eppendorf tube and stored at −20°C.
Protein extraction
A total of 60 µl elution buffer [7 M urea, 1% (w/v) CHAPS] was added to 10 µl serum (n=6/group). Subsequently, dithiothreitol was added to reach a final concentration of 10 mM. The samples were boiled at 56°C in water for 1 h, followed by the addition of PBS to achieve a concentration of 55 mM, and were incubated for 1 h in the dark at room temperature. The addition of iced pure acetone resulted in the formation of precipitate, followed by centrifugation at 4,000 × g at 4°C for 10 min, and removal of the supernatant. The precipitate was dissolved in 300 µl physiological saline in a vortex tube for 3 min. The proteins were quantified using a Bradford assay.
Liquid chromatography and MS
Serum proteome was analyzed using LTQ-Orbitrap-Veces iFunnel (Thermo Fisher Scientific, Inc., Waltham, MA, USA) equipped with a reversed-phase capillary column and interfaced with the nanoflow LC system (1,100; Agilent Technologies, Inc., Santa Clara, CA, USA). The peptides (500 ml) were enriched on the C18 enrichment column and separated on a 75 µm ×43 mm analytical/separation column in the protein chip (Agilent HPLC-Chip: G4240-62001ZORBAX 300SB-C18; Agilent Technologies, Inc.) using a gradient mobile phase consisting of two different solvents, 0.1% formic acid solution (solvent A) and 90% acetonitrile (solvent B), at a flow rate of 200 nl/min. The following gradient method was used for the separation of peptides on the chip over a period of 60 min: From 0–60%. Nitrogen gas was maintained at 120°C with a 9 l/min flow rate and a nebulizer pressure of 207 kPa. Positive ions were generated via electrospray and MRM transitions were assessed using 350–1,750 m/z. The MS/MS data were further analyzed using MaxQuant (version 1.2.2.5; http://www.maxquant.org). MaxQuant is designed as a three-tiered application for the analysis of data, application logic and presentation. The spectra data were determined and subsequently searched using the UniProt database (http://www.uniprot.org/). Pathway analysis was performed with Ingenuity® Pathway Analysis (IPA) software version 1 (Ingenuity Systems; Qiagen, Inc., Valencia, CA, USA).
Statistical analysis
Data are expressed as the mean ± standard deviation of at least three independent experiments. Statistical analysis was performed using SPSS version 16.0 software (SPSS, Inc., Chicago, IL, USA). A Student's t-test was used to compare the discrepancy between two groups. One-way analysis of variance followed by Duncan's test was used to determine the difference between multiple groups. P<0.05 was considered to indicate a statistically significant difference.
Results
Sinomenine improves clinical arthritic conditions in CIA rats
The present study investigated the in vivo efficacy of sinomenine in CIA rats. The CIA model was elicited in a genetically susceptible rat strain by immunization with CII emulsified in complete Freund's adjuvant. The body weights of the rats were monitored weekly, and the results demonstrated that beginning from day 21, CIA rats gained less weight compared with in the blank control group. Treatment with sinomenine (week 5, high dose) significantly reversed weight loss caused by RA compared with in the model group (Table III).
Table III.
Body weights (g) of rats with collagen-induced arthritis.
| Group | Week 2 | Week 3 | Week 4 | Week 5 | Week 6 |
|---|---|---|---|---|---|
| Blank control | 244.0±15.4 | 285.3±16.3 | 324.3±22.9 | 358.5±30.2 | 380.5±30.7 |
| Model | 244.8±23.6 | 263.4±30.2 | 286.7±31.9a | 312.0±31.7a | 300.3±29.5b |
| Positive control | 246.0±24.2 | 276.4±39.7 | 299.8±41.2 | 318.2±44.0 | 313.2±41.9b |
| High dose | 240.4±27.6 | 267.7±32.7 | 293.8±30.8 | 331.9±36.7a,d | 319.6±33.2b,c |
| Middle dose | 234.1±26.2 | 251.0±34.0a | 278.8±36.5a | 309.1±42.5a | 308.6±40.8b |
| Low dose | 246.8±27.2 | 260.1±39.8 | 281.8±36.8a | 310.4±34.4a | 313.8±32.1b |
P<0.05
P<0.01 vs. the blank control group.
P<0.05
P<0.01 vs. the model group.
Clinical score was used to measure the progression of arthritis development. The model group developed severe swelling, erythema and joint rigidity of the hind paws after 6 weeks (data not shown). Conversely, the experimental and positive control groups exhibited showed a lower AI (P<0.05) compared with in the model group. In addition, in the high dose sinomenine group, the AI was significantly attenuated compared with in the model group (P<0.01; Table IV). These results indicated that sinomenine and methotrexate may improve clinical arthritic conditions in CIA rats, and high dose sinomenine treatment exerted the optimal efficacy in CIA rats.
Table IV.
Arthritis index of rats with collagen-induced arthritis at week 6.
| Group | Arthritis index |
|---|---|
| Model | 13.5±0.9 |
| Positive control | 8.1±2.5a |
| High dose | 6.4±2.3b |
| Middle dose | 10.5±2.0a |
| Low dose | 10.5±1.8a |
P<0.05
P<0.01 vs. the model group.
Sinomenine improves histological parameters in CIA rats
The histology of tissues from CIA rats was analyzed, in order to determine whether sinomenine prevented articular destruction of talocrural joints. As shown in Fig. 1, infiltration of inflammatory cells, pannus invasion, cartilage damage and subchondral bone erosion were detected in CIA rats (Fig. 1). Histological scores of the individual groups are shown in Table V. The histological score of the model group was significantly higher than in the blank control group rats (P<0.01), and was reduced in the experimental groups, which indicated that sinomenine improved joint histological conditions, synovial swelling, congestion and hyperplasia in CIA rats (Table V). The joints of CIA rats treated with a high dose of sinomenine demonstrated less inflammatory cell infiltration and synovial hyperplasia than the positive control group. These results suggested that sinomenine improved the histological parameters in CIA rats.
Figure 1.

Effects of sinomenine on histological parameters of rats with collagen-induced arthritis. Histological analysis of the knee joints of control, positive control and sinomenine-treated groups. Sections were stained with haematoxylin and eosin. Morphological alterations were observed under a microscope at 200× magnification.
Table V.
Histological score of joints in rats.
| Group | Number | Score |
|---|---|---|
| Blank control | 8 | 1.00±0.00 |
| Model | 8 | 5.50±1.41a |
| Positive control | 8 | 4.00±1.07b |
| Low dose | 8 | 4.25±1.04 |
| Middle dose | 8 | 4.00±1.07b |
| High dose | 8 | 3.75±1.04b |
P<0.01 vs. the blank control group.
P<0.05 vs. the model group.
Sinomenine attenuates the inflammatory response in the joints of CIA rats
The present study next investigated the mechanisms underlying the decreased occurrence and severity of CIA following sinomenine treatment. The results of RF detection detected an apparent discrepancy between sinomenine-treated groups and the model group (P<0.05). Notably, high dose sinomenine exhibited an improved anti-arthritic effect compared with low dose sinometine (Table VI).
Table VI.
Expression levels of rheumatoid factor in serum at week 6.
| Group | Rheumatoid factor (IU/ml) |
|---|---|
| Blank control | 5,007.8±3,168.2 |
| Model | 9,176.5±3,757.2a |
| Positive control | 5,048.2±3,132.2b |
| High dose | 4,578.0±3,489.5b |
| Middle dose | 4,750.8±4,764.3b |
| Low dose | 5,756.3±4,963.4c |
P<0.05 vs. the blank control group.
P<0.01
P<0.05 vs. the model group.
The expression levels of CRP in the positive control group were significantly lower than in the model group (Table VII). Sinomenine treatment attenuated the secretion of CRP in CIA rats compared with in the model or positive control groups. These findings indicated that sinomenine exhibited an improved anti-arthritic effect compared with methotrexate.
Table VII.
Expression levels of C-reactive protein in serum at week 6.
| Group | C-reactive protein (mg/ml) |
|---|---|
| Blank control | 261.0±50.2 |
| Model | 636.3±123.4a |
| Positive control | 578.1±164.2a,b |
| High dose | 340.0±85.4b,c |
| Middle dose | 489.2±107.1d,e |
| Low dose | 679.9±21.2 |
P<0.01 vs. the control group.
P<0.01 vs. the model group.
P<0.01 vs. the positive control group.
P<0.05 vs. the model group.
P<0.05 vs. the positive control group.
The results revealed that the secretion of ALT and AST was not significantly different between the sinomenine-treated groups and the blank control group; whereas ALT was significantly decreased in the high dose and positive control groups compared with the model group. Furthermore, a marked decrease of ALT and AST expression levels were observed in the high dose group compared with the middle and low dose groups (Table VIII). ALT and AST are the major markers of hepatic damage in the plasma. Taken together, the results suggest that a high dose of sinomenine exerted significant liver function improvement in CIA rats (Table VIII) compared with the model group. Furthermore, the positive control group demonstrated a significant decrease in leukocyte, erythrocyte and hemoglobin levels compared with the blank control group. Bone marrow suppression represents the decrease in the production of leukocytes, erythrocytes and/or platelets (21). Therefore, it can be suggested that methotrexate caused bone marrow suppression in CIA rats (Table IX). However, there were no significant alterations between the sinomenine-treated groups and the blank control group, which indicated that sinomenine did not induce bone marrow suppression and liver damage. In addition, the number of platelets in the low dose sinomenine group was significantly increased compared with in the blank control group, which indicated that low dose sinomenine treatment exerted a marked increase in platelet production or release. Therefore, sinomenine may exert an improved anti-arthritic effect, associated with no liver damage and bone marrow inhibition compared with methotrexate, which is associated with chronic liver damage (22). These results suggested that sinomenine may be used in the clinical treatment of RA.
Table VIII.
Expression levels of AST and ALT in serum.
| Group | ALT (U/l) | AST (U/l) |
|---|---|---|
| Blank control | 7.99±3.38 | 10.84±4.08 |
| Model | 10.30±2.11 | 14.39±1.98 |
| Positive control | 7.63±1.62a | 12.13±2.34 |
| High dose | 7.15±2.33a | 11.77±3.69a |
| Middle dose | 7.96±2.11 | 13.15±1.16 |
| Low dose | 8.51±3.69 | 13.13±5.48 |
P<0.05 vs. the model group. AST, aspartate aminotransferase; ALT, alanine aminotransferase.
Table IX.
Blood analysis.
| Group | Leukocytes | Erythrocytes | Hemoglobin | Platelets |
|---|---|---|---|---|
| Blank control | 6.57±1.54 | 7.64±0.71 | 151.38±9.40 | 1,031.8±107.3 |
| Model | 6.58±0.97 | 6.75±1.10 | 130.75±18.30 | 939.4±124.4 |
| Positive control | 5.60±1.22a,b | 6.74±0.49a | 134.25±8.96a | 1,342.0±138.1a,b |
| High dose | 6.66±1.69 | 7.01±1.53 | 133.88±34.66 | 1,115.3±270.9 |
| Middle dose | 6.95±2.20 | 7.68±0.76 | 151.57±18.44 | 1,063.1±172.8 |
| Low dose | 6.93±1.75 | 7.57±0.53 | 139.29±19.90 | 1,308.1±197.1a |
P<0.01 vs. the blank control group.
P<0.01 vs. the model group.
Identification of differentially expressed proteins between sinomenine-treated groups and model group
To investigate the underlying mechanisms involved in sinomenine-treated CIA rats, proteomic analysis was performed. The data revealed that 320 differential proteins were expressed in the sinomenine-treated groups compared with in the model group. There were 79 differentially expressed proteins identified in the low dose group, and among them, 36 proteins were upregulated. The top 12 up- and downregulated proteins were presented in Table X. In addition, five highly relevant biological processes were identified from 16 relevant biological processes by gene ontology enrichment analysis (13). These biological processes were cell cycle (P-value 6.66×10⁻³-8.91×10⁻⁶; 14 associated genes); cell morphology (P-value, 6.43×10⁻³-2.82×10⁻⁴; 24 associated genes); cellular function and maintenance (P-value, 6.43×10⁻³-4.52×10⁻⁴; 22 associated genes); cellular assembly and organization (P-value, 6.43×10⁻³-7.78×10⁻⁴; 24 associated genes); and post-translational modification (P-value, 3.22×10⁻³-7.78×10⁻⁴; 6 associated genes) (Table XI). In addition, biological processes were associated with statistically relevant molecular pathways. IPA was used to investigate the involvement of signaling pathways. The results indicated that 213 signaling pathways were enriched, which were involved in the low dose sinomenine-treated group compared with in the model group. The 37 most enriched signaling pathways are listed in Fig. 2.
Table X.
Top 12 up- and downregulated differentially expressed proteins between the sinomenine-treated group and model group.
| Gene name | Accession no. | Fold change |
|---|---|---|
| Amot | A0A067XG49 | −1.8538 |
| Phf20l1 | Q6P7V2 | −1.6297 |
| Myom1 | Q62234 | −1.5777 |
| Rbl1 | Q64701 | −1.5508 |
| Pla2g4d | Q14CI2 | −1.5336 |
| Slc4a3 | Q68EG4 | −1.5128 |
| Dcaf5 | Q80T85 | −1.4726 |
| Dido1 | Q8C9B9 | −1.4686 |
| Speer1 | J3QMX3 | −1.4320 |
| Hfm1 | F6XQ35 | −1.4088 |
| Trcg1 | Q58Y74 | −1.4086 |
| Tmem131 | O70472 | −1.3927 |
| Dnah7c | A0A087WR13 | 1.6626 |
| Dnah7a | E9Q0T8 | 1.6626 |
| Ptprf | A2A8L5 | 1.7042 |
| Ankrd27 | Q3UMR0-2 | 1.7052 |
| Fgfr2 | A1YYM7 | 1.8464 |
| Nup155 | Q6ZQ45 | 1.8588 |
| Ctnna1 | Q545R0 | 1.8978 |
| Tpr | Q8BK71 | 2.0978 |
| Rictor | Q6QI06-2 | 2.2287 |
| Dnajc8 | F6TQL3 | 2.2831 |
| Prokr2 | Q8K458 | 3.6995 |
| Antxr2 | Q6DFX2 | 6.0189 |
Fold changes represent the model group vs. the sinomenine-treated group.
Table XI.
Functional analysis between the sinomenine-treated group and model group.
| Comparison | Name | P-value | Molecules |
|---|---|---|---|
| MVD (Model group vs. Sinomenine-treated group) | Cell cycle | 6.66×10⁻³-8.91×10⁻⁶ | 14 |
| Cell morphology | 6.43×10⁻³-2.82×10⁻⁴ | 24 | |
| Cellular function and maintenance | 6.43×10⁻³-4.52×10⁻⁴ | 22 | |
| Cellular assembly and organization | 6.43×10⁻³-7.78×10⁻⁴ | 24 | |
| Post-translational modification | 3.22×10⁻³-7.78×10⁻⁴ | 6 |
Figure 2.
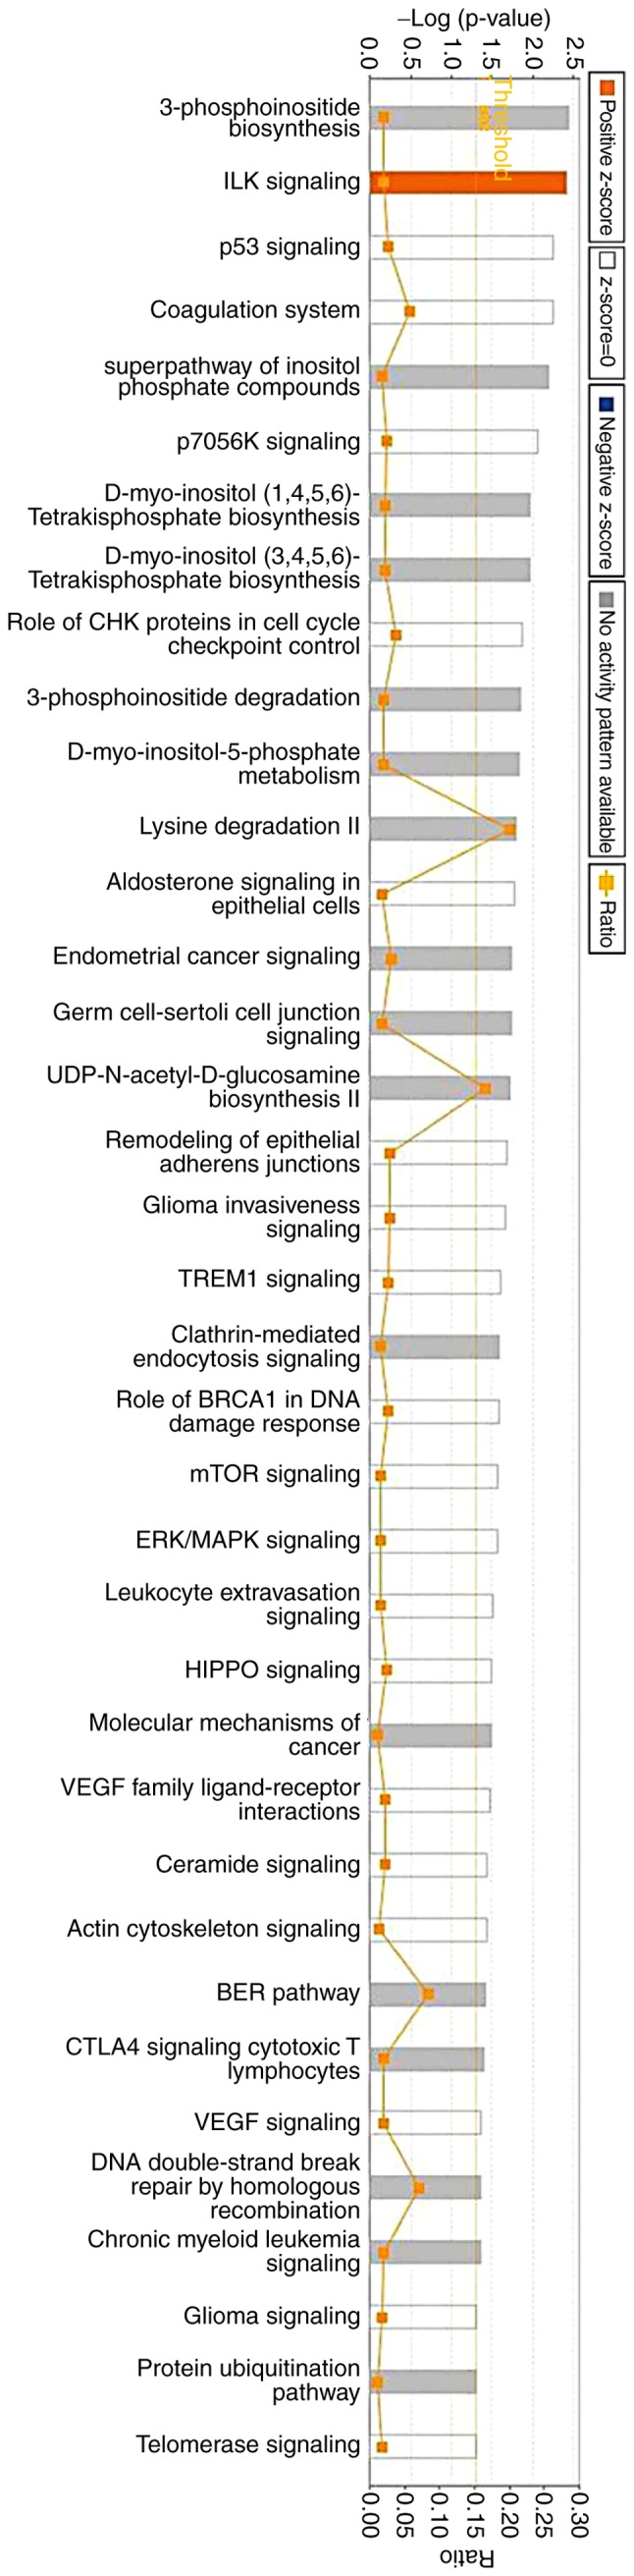
A total of 37 pathways were selected as richly expressed via Ingenuity® Pathway Analysis.
Identification of proteins involved in the inflammation-associated pathway
The present study used IPA software to investigate the association between differentially expressed proteins by analyzing enrichment. A protein-protein interaction network was constructed by calculating the score, which indicated that 33 proteins were associated with other proteins and led to 60 paired relationships. These proteins were primarily involved in immunomodulatory and inflammatory reactions. In addition, nuclear factor (NF)-κB, histone H3, heat shock protein (Hsp)70 and protein kinase B (Akt) were the main proteins to regulate the network (Fig. 3). Among them, 14 proteins were upregulated and 7 proteins were downregulated. For example, if histone H3 was chosen, 14 paired relationships were connected (Fig. 3).
Figure 3.

Proteome analysis of sinomenine-treated CIA rats. Ingenuity® Pathway Analysis was used to detect the susceptibility proteins and upstream regulators in sinomenine-treated CIA rats. Representative network of proteins was identified in the low dose sinomenine-treated CIA rats via proteomic analysis. A total of 32 proteins were connected with 60 paired relationships. The proteins in green represent downregulation following treatment with sinomenine, the proteins in red represent upregulation following treatment with sinomenine and the proteins without any color were not detected via proteome analysis, but may be retrieved in the Uniprot database. CIA, collagen-induced arthritis.
Identification of upstream regulators
To identify the key upstream regulators governing molecular status following sinomenine treatment, an upstream regulator analysis with IPA was applied. The top seven upstream regulators that were predicted to be activated or inhibited in the sinomenine treated group are presented in Table XII. E2F1, TCF7L2, NUPR1, TGFβ1 and lipopolysaccharide were most top upstream regulators predicted to be induced following treatment with sinomenine; whereas CST5 and AHR were the top upstream regulators predicted to be inhibited following treatment with sinomenine (Table XII). Fig. 4 showed a graphical representation of the molecular networks that may exert important roles following sinomenine treatment, which revealed that the most significant upstream regulators were transforming growth factor (TGF)-β1, aryl hydrocarbon receptor (AHR) and cystatin D (CST5).
Table XII.
Upstream analysis.
| Upstream regulator | Molecule type | Activation z-score | P-value of overlap | Target molecules in dataset |
|---|---|---|---|---|
| CST5 | Other | −0.816 | 0.000331 | COL12A1, DDX21, DOCK9, NUP155, SSFA2, SSRP1 |
| E2F3 | Transcription regulator | 0.00154 | FGFR2, NCAPG2, PPP1R13B, RBL1 | |
| SP100 | Transcription regulator | 0.00202 | BRCA1, HSPA8 | |
| SMARCE1 | Transcription regulator | 0.00223 | BRCA1, CYLD | |
| E2F2 | Transcription regulator | 0.0201 | FGFR2, RBL1 | |
| E2F1 | Transcription regulator | 0.077 | 0.0212 | BRCA1, FGFR2, HSPA8, PPP1R13B, RBL1 |
| TCF7L2 | Transcription regulator | 1 | 0.0225 | CTNNA1, DOCK9, FGFR2, OTUD7B |
| Mmp | Group | 0.0232 | PLG | |
| NUP107 | Transporter | 0.0232 | TPR | |
| TMPO | Other | 0.0232 | COL12A1 | |
| ZNF423 | Transcription regulator | 0.0232 | BRCA1 | |
| PGK1 | Kinase | 0.0232 | PLG | |
| GW 5074 | Chemical-kinase inhibitor | 0.0232 | FGFR2 | |
| Boc-D-FMK | Chemical reagent | 0.0232 | RBL1 | |
| Rb | Group | 0.0243 | FGFR2, RBL1 | |
| AHR | Ligand-dependent nuclear Receptor | −1.982 | 0.0243 | COL12A1, FGFR2, FMO3, RBL1 |
| TBX2 | Transcription regulator | 0.0262 | NCAPG2, RBL1 | |
| PHF8 | Enzyme | 0.0265 | RBL1 | |
| S100A10 | Other | 0.0265 | PLG | |
| LIMS1 | Other | 0.0265 | CTNNA1 | |
| GRIP1 | Transcription regulator | 0.0265 | FREM2 | |
| ALCAM | Other | 0.0265 | AMOT | |
| TNRC6A | Other | 0.0265 | RBL1 | |
| NUPR1 | Transcription regulator | 0.447 | 0.0271 | ANK1, BRCA1, DIDO1, SHROOM3, SYNE2 |
| N-Ac-Leu-Leu-norleucinal | Chemical-protease inhibitor | 0.0289 | BRCA1, RBL1 | |
| TIP60 | Complex | 0.0298 | RBL1 | |
| SHOX | Transcription regulator | 0.0298 | RBL1 | |
| RBL2 | Other | 0.0436 | BRCA1, RBL1 | |
| RRP1B | Other | 0.0444 | BRCA1, RBL1 | |
| COL9A1 | Other | 0.0459 | COL12A1 | |
| PHB | Transcription regulator | 0.0459 | RBL1 | |
| Gamma-tocotrienol | Chemical drug | 0.0459 | OTUD7B | |
| CTGF | Growth factor | 0.046 | ABCF1, MIA3 | |
| TGFB1 | Growth factor | 0.956 | 0.0482 | AASS, ABCF1, COL12A1, DDX21, FGFR2, MIA3, PPP1R13B, RBL1, RICTOR, SSRP1 |
| Dactolisib | Chemical drug | 0.0491 | RICTOR | |
| TNFAIP2 | Other | 0.0491 | RBL1 | |
| RGS1 | Other | 0.0491 | RBL1 | |
| NDN | Transcription regulator | 0.0491 | RBL1 | |
| Lipopolysaccharide | Chemical drug | 1.969 | 1 | COL12A1, F2, HSPA8, PLG |
Figure 4.
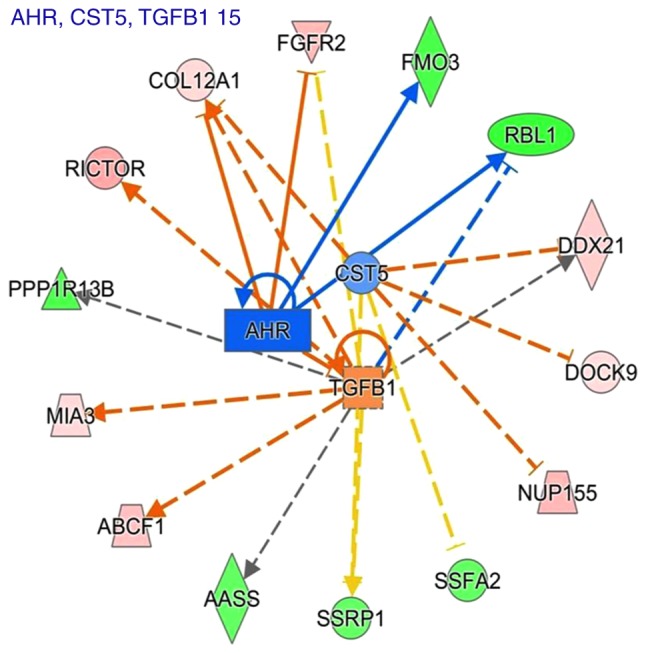
Predicted regulatory networks affected by sinomenine treatment via Ingenuity® Pathway Analysis. The predicted upstream regulators were TGF-β1, AHR and CST5, and the target molecules of these upstream regulators were also shown. The solid lines represented a direct interaction between two proteins, whereas the dotted lines represent an indirect association. The length of the lines reflects the strength of reported evidence supporting the node-to-node relationship. AHR, aryl hydrocarbon receptor; CST5, cystatin D; TGF-β1, transforming growth factor β1.
Discussion
To gain an insight into the mechanism underlying the effects of sinomenine on RA, the present study used an animal experimental arthritis model. Rats were administered with sinomenine, methotrexate or vehicle. In the CIA study, the protective effects of sinomenine against arthritis were confirmed, as evidenced by the decreased incidence and severity of arthritis following CII immunization. Sinomenine also exerted an anti-inflammatory effect, as revealed by the suppression of CRP expression. These results are consistent with those of previous studies. Yang et al (23) reported that sinomenine exerts protective effects against lipopolysaccharide-induced inflammation in piglets. Additionally, Xu et al (9) reported that sinomenine and NSAID treatment regulates CRP and improved clinical conditions of RA. Furthermore, in the present study, sinomenine did not exert liver damage or bone marrow inhibition compared with in the positive control group. To the best of our knowledge, no previous studies have focused on proteomic analysis following treatment of CIA rats with sinomenine. The current proteomic analysis study revealed that NF-κB, histone, Hsp70 and Akt interacted with other proteins, leading to 60 relationship pairs. Taken together, these results indicated that the use of sinomenine has the potential to treat RA, and the present study identified pathways in the rats with CIA involved in the response to sinomenine. These results provide information to suggest that sinomenine may be used to treat RA.
In the present study, dual high-performance liquid chromatography and MS were performed to identify the protein profiles associated with sinomenine treatment in rats with CIA. A total of 320 proteins were differentially expressed. In response to treatment with low dose sinomenine, there were 79 differentially expression proteins, among which 36 proteins were downregulated. The differentially expressed proteins were involved in tumorigenesis, developmental disorder, inflammatory, cell morphology, lipid metabolism, cell cycle, amino acid metabolism, gene expression and drug metabolism. The present study focused on network analysis via IPA software to construct the protein network in the low dose sinomenine treatment group. NF-κB, histone H3, Hsp70 and Akt were involved in the enrichment networks as core proteins, which was determined using Uniprot (http://www.uniprot.org/). In addition, the key upstream regulators that governed molecular status following sinomenine treatment were predicted; the most significant upstream regulators were TGF-β1, AHR and CST5.
Akt is involved in the phosphoinositide 3-kinase (PI3K)/Akt signaling pathway. Akt kinase activity is induced following activation of PI3K in growth factor receptor-mediated signaling cascades (24). Akt is involved in tumor formation, and is also involved in higher brain function, cell size matters, cell cycle regulation and metabolic functions, and serves various roles in diseases and biological functions (25). In the present study, the proteomic analysis results revealed that enriched proteins are associated with Akt expression, thus suggesting that Akt may function as an inducer of these proteins. Therefore, the present study provided evidence to suggest that Akt is a target of the far-reaching physiological effects regulated by sinomenine in RA, as in tumor and brain disease.
IPA upstream regulator analysis predicted that the most significant upstream regulators associated with sinomenine treatment are TGF-β1, AHR and CST5. Previously, Sugiura et al (26) reported that TGF-β1 is highly expressed in joints in RA, and it is considered an anti-inflammatory regulator in RA. AHR activation may induce the production of inflammatory cytokines and RA synoviocytes (27). The present findings suggested that TGF-β1 and AHR serve a key role in the anti-arthritic effects of sinomenine. Therefore, it was hypothesized that sinomenine exerted its anti-arthritic effects via inhibition of TGF-β1 and AHR. To the best of our knowledge, there are no published studies investigating the association between RA and the expression level of CST5. In the future, the authors of the present study aim to study the association between CST5 and RA. In the present study, Akt expression enrichment was inhibited by sinomenine in CIA rats. Therefore, it was hypothesized that TGF-β1 may mediate Akt activity in RA, and both were downregulated by sinomenine. It has previously been reported that TGF-β1 enhances Akt phosphorylation in MC3T3-E1 cells (28) and A549 cells (29). The present data are consistent with these studies; however, further investigations are required to confirm this hypothesis.
The present study explored the anti-arthritic and anti-inflammatory effects of sinomenine in vivo. To the best of our knowledge, the present study is the first to perform a proteomic analysis for analyzing the effects of sinomenine against RA using a CIA rat model. The present study aimed to elucidate the associated proteins involved in sinomenine-treated RA via proteomic analysis. The results of the present study revealed that sinomenine exerted anti-arthritic effects via numerous targets during CIA. In addition, the proteomic analysis provided a novel approach and evidence for exploring the other biological effects of sinomenine. Therefore, the findings may provide an insight into the anti-RA mechanisms of sinomenine and proteomic analysis may be used to explore its functions in other relevant diseases.
Acknowledgements
The authors would like to thank Jinjin Shang for proof reading the manuscript.
Funding
No funding was received.
Availability of data and materials
The datasets used and/or analyzed during the current study are available from the corresponding author upon reasonable request.
Authors' contributions
XQ, ZZ and HC designed the study and performed the experiments. WS, ZX and BZ analyzed and interpreted the experimental data, and drafted the manuscript.
Ethics approval and consent to participate
The present study was approved by the Institutional Animal Care and Use Committee of Nanjing University of Chinese Medicine (Nanjing, China).
Consent for publication
Not applicable.
Conflicts of interest
The authors declare that they have no competing interests.
References
- 1.Gu X, Gu B, Lv X, Yu Z, Wang R, Zhou X, Qiao W, Mao Z, Zuo G, Li Q, et al. 1, 25-dihydroxy-vitamin D3 with tumor necrosis factor-alpha protects against rheumatoid arthritis by promoting p53 acetylation-mediated apoptosis via Sirt1 in synoviocytes. Cell Death Dis. 2016;7:e2423. doi: 10.1038/cddis.2016.300. [DOI] [PMC free article] [PubMed] [Google Scholar]
- 2.Boissier MC, Semerano L, Challal S, Saidenberg-Kermanac'h N, Falgarone G. Rheumatoid arthritis: From autoimmunity to synovitis and joint destruction. J Autoimmun. 2012;39:222–228. doi: 10.1016/j.jaut.2012.05.021. [DOI] [PubMed] [Google Scholar]
- 3.Burmester GR, Bijlsma JWJ, Cutolo M, McInnes IB. Managing rheumatic and musculoskeletal diseases - past, present and future. Nat Rev Rheumatol. 2017;13:443–448. doi: 10.1038/nrrheum.2017.95. [DOI] [PubMed] [Google Scholar]
- 4.Wang Y, Fang Y, Huang W, Zhou X, Wang M, Zhong B, Peng D. Effect of sinomenine on cytokine expression of macrophages and synoviocytes in adjuvant arthritis rats. J Ethnopharmacol. 2005;98:37–43. doi: 10.1016/j.jep.2004.12.022. [DOI] [PubMed] [Google Scholar]
- 5.Qian L, Xu Z, Zhang W, Wilson B, Hong JS, Flood PM. Sinomenine, a natural dextrorotatory morphinan analog, is anti-inflammatory and neuroprotective through inhibition of microglial NADPH oxidase. J Neuroinflammation. 2007;4:23. doi: 10.1186/1742-2094-4-23. [DOI] [PMC free article] [PubMed] [Google Scholar]
- 6.Zhou B, Lu X, Tang Z, Liu D, Zhou Y, Zeng P, Xiong H. Influence of sinomenine upon mesenchymal stem cells in osteoclastogenesis. Biomed Pharmacother. 2017;90:835–841. doi: 10.1016/j.biopha.2017.03.084. [DOI] [PubMed] [Google Scholar]
- 7.Zhang HC, Liu MX, Wang EP, Lin Z, Lv GF, Chen X. Effect of sinomenine on the expression of rheumatoid arthritis fibroblast-like synoviocytes MyD88 and TRAF6. Genet Mol Res. 2015;14:18928–18935. doi: 10.4238/2015.December.28.41. [DOI] [PubMed] [Google Scholar]
- 8.Chen XM, Huang RY, Huang QC, Chu YL, Yan JY. Systemic review and meta-analysis of the clinical efficacy and adverse effects of zhengqing fengtongning combined with methotrexate in rheumatoid arthritis. Evid Based Complement Alternat Med. 2015;2015:910376. doi: 10.1155/2015/910376. [DOI] [PMC free article] [PubMed] [Google Scholar]
- 9.Xu M, Liu L, Qi C, Deng B, Cai X. Sinomenine versus NSAIDs for the treatment of rheumatoid arthritis: A systematic review and meta-analysis. Planta Med. 2008;74:1423–1429. doi: 10.1055/s-2008-1081346. [DOI] [PubMed] [Google Scholar]
- 10.Wang Q, Li XK. Immunosuppressive and anti-inflammatory activities of sinomenine. Int Immunopharmacol. 2011;11:373–376. doi: 10.1016/j.intimp.2010.11.018. [DOI] [PubMed] [Google Scholar]
- 11.Kumar A, Snyder M. Protein complexes take the bait. Nature. 2002;415:123–124. doi: 10.1038/415123a. [DOI] [PubMed] [Google Scholar]
- 12.Wepf A, Glatter T, Schmidt A, Aebersold R, Gstaiger M. Quantitative interaction proteomics using mass spectrometry. Nat Methods. 2009;6:203–205. doi: 10.1038/nmeth.1302. [DOI] [PubMed] [Google Scholar]
- 13.Pflieger D, Gonnet F, de la Fuente van Bentem S, Hirt H, de la Fuente A. Linking the proteins-elucidation of proteome-scale networks using mass spectrometry. Mass Spectrom Rev. 2011;30:268–297. doi: 10.1002/mas.20278. [DOI] [PubMed] [Google Scholar]
- 14.Gollapalli K, Ghantasala S, Kumar S, Srivastava R, Rapole S, Moiyadi A, Epari S, Srivastava S. Subventricular zone involvement in Glioblastoma-A proteomic evaluation and clinicoradiological correlation. Sci Rep. 2017;7:1449. doi: 10.1038/s41598-017-01202-8. [DOI] [PMC free article] [PubMed] [Google Scholar]
- 15.Ray S, Patel SK, Venkatesh A, Chatterjee G, Ansari NN, Gogtay NJ, Thatte UM, Gandhe P, Varma SG, Patankar S, Srivastava S. Quantitative proteomics analysis of plasmodium vivax induced alterations in human serum during the acute and convalescent phases of infection. Sci Rep. 2017;7:4400. doi: 10.1038/s41598-017-04447-5. [DOI] [PMC free article] [PubMed] [Google Scholar]
- 16.Noh R, Park SG, Ju JH, Chi SW, Kim S, Lee CK, Kim JH, Park BC. Comparative proteomic analyses of synovial fluids and serums from rheumatoid arthritis patients. J Microbiol Biotechnol. 2014;24:119–126. doi: 10.4014/jmb.1307.07046. [DOI] [PubMed] [Google Scholar]
- 17.Cheng Y, Chen Y, Sun X, Li Y, Huang C, Deng H, Li Z. Identification of potential serum biomarkers for rheumatoid arthritis by high-resolution quantitative proteomic analysis. Inflammation. 2014;37:1459–1467. doi: 10.1007/s10753-014-9871-8. [DOI] [PubMed] [Google Scholar]
- 18.Yanagida M, Kawasaki M, Fujishiro M, Miura M, Ikeda K, Nozawa K, Kaneko H, Morimoto S, Takasaki Y, Ogawa H, et al. Serum proteome analysis in patients with rheumatoid arthritis receiving therapy with tocilizumab: An anti-interleukin-6 receptor antibody. Biomed Res Int. 2013;2013:607137. doi: 10.1155/2013/607137. [DOI] [PMC free article] [PubMed] [Google Scholar]
- 19.Brand DD, Latham KA, Rosloniec EF. Collagen-induced arthritis. Nat Protoc. 2007;2:1269–1275. doi: 10.1038/nprot.2007.173. [DOI] [PubMed] [Google Scholar]
- 20.Jones-Bolin S. Guidelines for the care and use of laboratory animals in biomedical research. Curr Protoc Pharmacol Appendix 4: Appendix 4B. 2012 doi: 10.1002/0471141755.pha04bs59. [DOI] [PubMed] [Google Scholar]
- 21.Feng L, Huang Q, Huang Z, Li H, Qi X, Wang Y, Liu Z, Liu X, Lu L. Optimized animal model of cyclophosphamide-induced bone marrow suppression. Basic Clin Pharmacol Toxicol. 2016;119:428–435. doi: 10.1111/bcpt.12600. [DOI] [PubMed] [Google Scholar]
- 22.Safaei F, Mehrzadi S, Haghighian Khadem H, Hosseinzadeh A, Nesari A, Dolatshahi M, Esmaeilizadeh M, Goudarzi M. Protective effects of gallic acid against methotrexate-induced toxicity in rats. Acta Chir Belg. 2017;25:1–9. doi: 10.1080/00015458.2017.1394672. [DOI] [PubMed] [Google Scholar]
- 23.Yang H, Jiang C, Chen X, He K, Hu Y. Protective effects of sinomenine against LPS-induced inflammation in piglets. Microb Pathog. 2017;110:573–577. doi: 10.1016/j.micpath.2017.07.044. [DOI] [PubMed] [Google Scholar]
- 24.Butler MG, Dasouki MJ, Zhou XP, Talebizadeh Z, Brown M, Takahashi TN, Miles JH, Wang CH, Stratton R, Pilarski R, Eng C. Subset of individuals with autism spectrum disorders and extreme macrocephaly associated with germline PTEN tumour suppressor gene mutations. J Med Genet. 2005;42:318–321. doi: 10.1136/jmg.2004.024646. [DOI] [PMC free article] [PubMed] [Google Scholar]
- 25.Franke TF. PI3K/Akt: Getting it right matters. Oncogene. 2008;27:6473–6488. doi: 10.1038/onc.2008.313. [DOI] [PubMed] [Google Scholar]
- 26.Sugiura Y, Niimi T, Sato S, Yoshinouchi T, Banno S, Naniwa T, Maeda H, Shimizu S, Ueda R. Transforming growth factor beta1 gene polymorphism in rheumatoid arthritis. Ann Rheum Dis. 2002;61:826–828. doi: 10.1136/ard.61.9.826. [DOI] [PMC free article] [PubMed] [Google Scholar]
- 27.Nguyen NT, Nakahama T, Nguyen CH, Tran TT, Le VS, Chu HH, Kishimoto T. Aryl hydrocarbon receptor antagonism and its role in rheumatoid arthritis. J Exp Pharmacol. 2015;7:29–35. doi: 10.2147/JEP.S63549. [DOI] [PMC free article] [PubMed] [Google Scholar]
- 28.Suzuki E, Ochiai-Shino H, Aoki H, Onodera S, Saito A, Saito A, Azuma T. Akt activation is required for TGF-β1-induced Osteoblast differentiation of MC3T3-E1 pre-osteoblasts. PLoS One. 2014;9:e112566. doi: 10.1371/journal.pone.0112566. [DOI] [PMC free article] [PubMed] [Google Scholar]
- 29.Jo E, Park SJ, Choi YS, Jeon WK, Kim BC. Kaempferol suppresses transforming growth factor-β1-induced epithelial-to-mesenchymal transition and migration of A549 lung cancer cells by inhibiting Akt1-mediated phosphorylation of Smad3 at Threonine-179. Neoplasia. 2015;17:525–537. doi: 10.1016/j.neo.2015.06.004. [DOI] [PMC free article] [PubMed] [Google Scholar]
Associated Data
This section collects any data citations, data availability statements, or supplementary materials included in this article.
Data Availability Statement
The datasets used and/or analyzed during the current study are available from the corresponding author upon reasonable request.