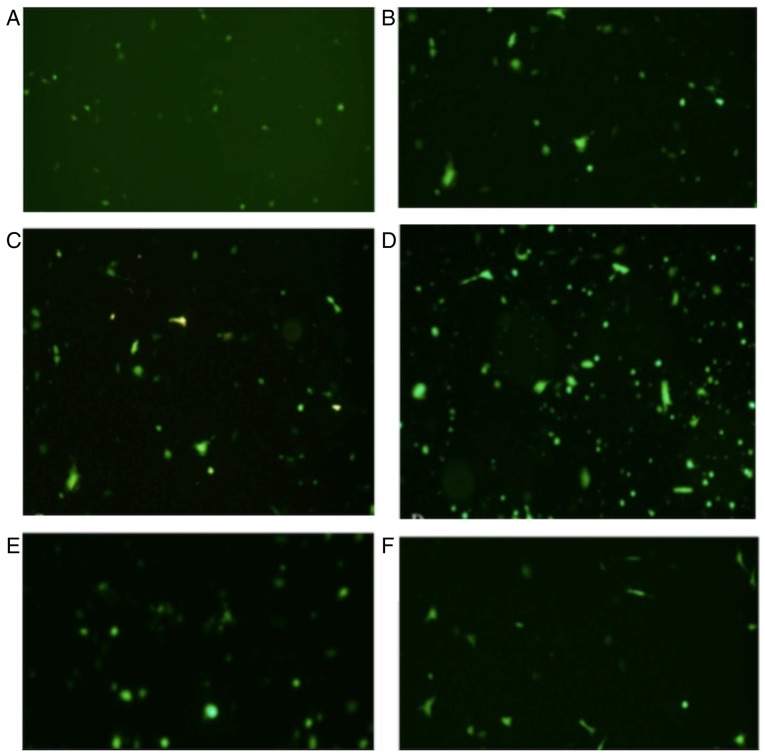
Figure 6.
Fluorescent protein expression investigated using fluorescence microscopy. Picture A to F showed the fluorescent protein expression in (A) 6 h, (B) 12 h, (C) 18 h, (D) 24 h, (E) 32 h and (F) 40-h time intervals following transfection. The expression of fluorescence exhibited in (D) represents the greatest transfection ratio.

