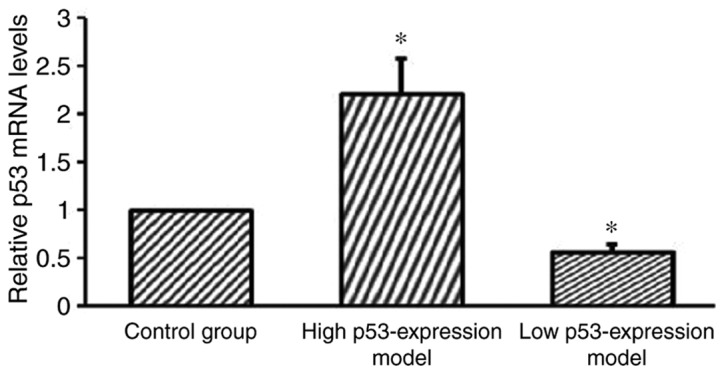
Figure 7.

Reverse transcription-quantitative polymerase chain reaction analyses of the expression level of p53 exhibited by the high p53 expression model group, the low p53 expression model group and the control group. Both the high p53 expression model and the low p53 expression group demonstrated a statistically significant statistical difference in p53 expression compared with the control. *P<0.05 vs. control.
