Figure 8.

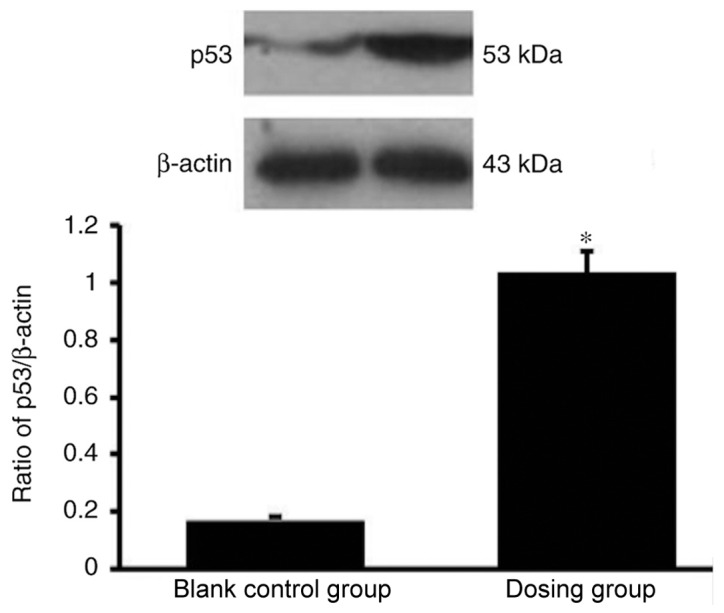
Western blot analysis of p53 in the propranolol group and the control is presented. p53 expression was significantly higher in the propranolol group compared with the control group. *P<0.05 vs. control.

Western blot analysis of p53 in the propranolol group and the control is presented. p53 expression was significantly higher in the propranolol group compared with the control group. *P<0.05 vs. control.