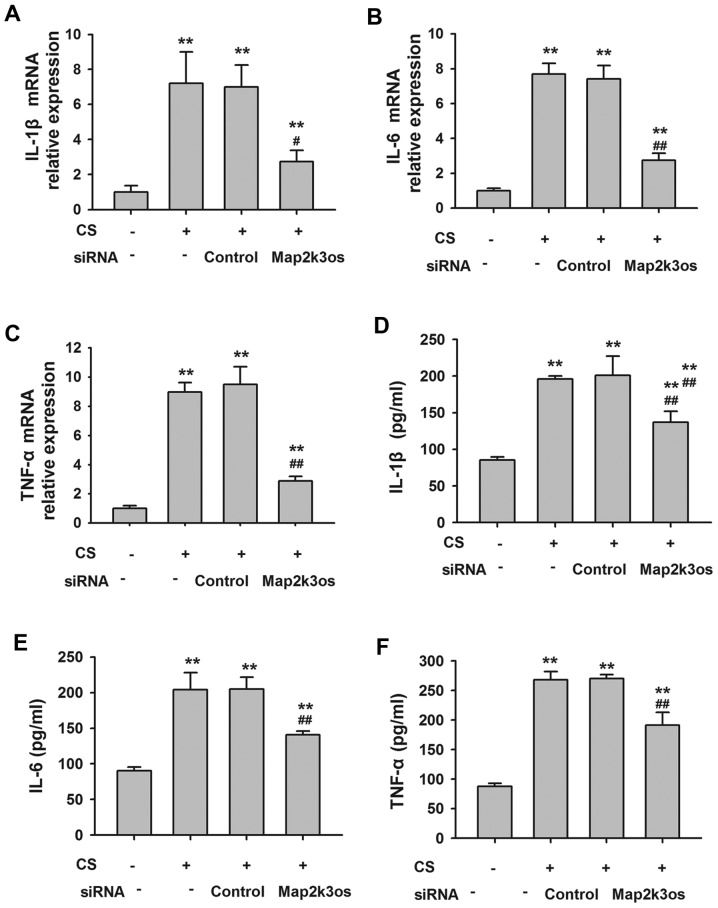
Figure 6.
mRNA expression levels of (A) IL-1β, (B) IL-6 and (C) TNF-α in MLE12 cells, as determined by RT-qPCR. Protein level of (D) IL-1β, (E) IL-6 and (F) TNF-α in the culture medium, as determined by ELISA. (n=6). **P<0.01 compared with control group without cyclic stretch or siRNA. ##P<0.01 compared with control siRNA group. CS, cyclic stretch; IL, interleukin; Map2k3os, mitogen-activated protein kinase kinase 3, opposite strand; RT-qPCR, reverse transcription-quantitative polymerase chain reaction; siRNA, small interfering RNA; TNF, tumor necrosis factor.

