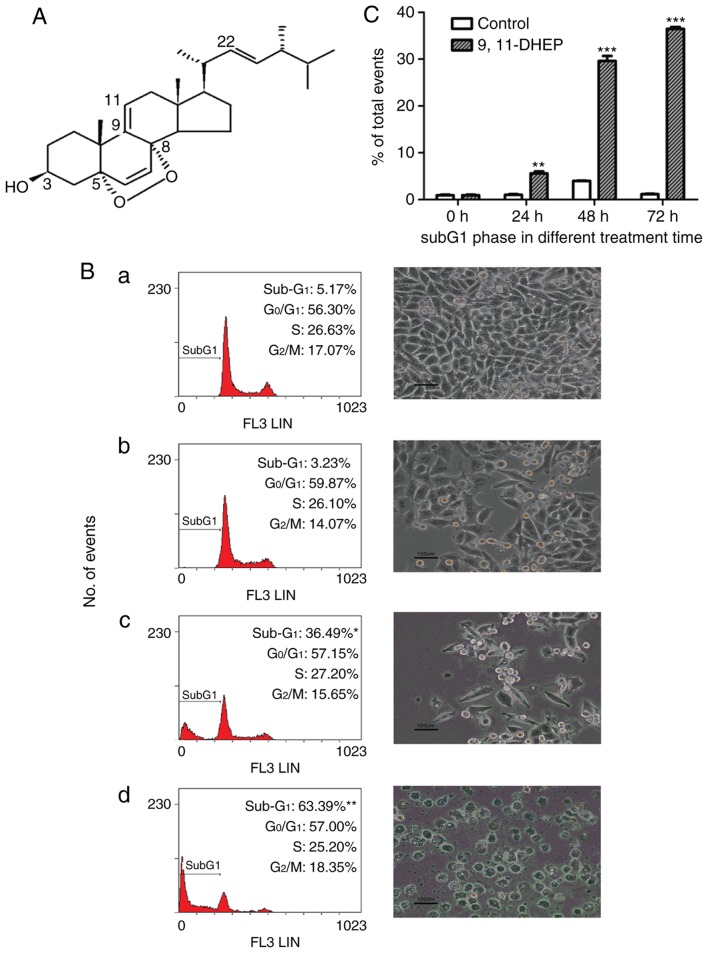
Figure 1.
Effects of 9(11)-DHEP on cell proliferation and apoptosis induction of A375 malignant melanoma cells. (A) The structure of 9(11)-DHEP. (B) DNA histograms (left column) and optical photograph (right column) of A375 malignant melanoma cells after 72 h treatment with 9(11)-DHEP at different concentration. Light microscope photographs were obtained at ×200 magnification. Cell cycle phase distributions were quantified by staining cells with propidium iodide. (Ba) Control; (Bb) 10 µg/ml; (Bc) 20 µg/ml; (Bd) 30 µg/ml. Results are expressed as percent of cells in sub-G1, G0/G0, S and G2/M phase at each time point after exposure. Data are mean (n=3). (C) Effect of 20 µg/ml 9(11)-DHEP on subG1 phase in A375 malignant melanoma cells at different incubation times. Results are expressed as mean ± SD (n=3). Differences with *P<0.05, **P<0.01 and ***P<0.001 were considered significantly different. 9(11)-DHEP, 9,11-dehydroergosterol peroxide.

