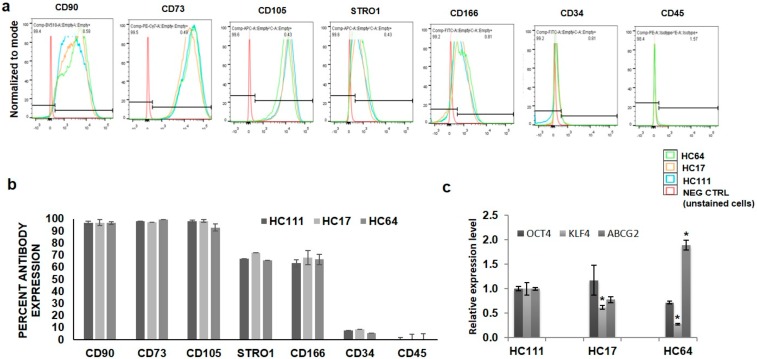
Figure 1.
Characterization of cell stemness. (a) Histograms showing the percentage of three CSSC populations of various stemness markers, endothelial and hematopoietic markers. (b) Bar diagram showing the comparative expression of various markers in CSSCs. (c) Real-time expression profiling for various stemness genes in three CSSC populations. *P < 0.05, **P < 0.001, ***P < 0.0001.

