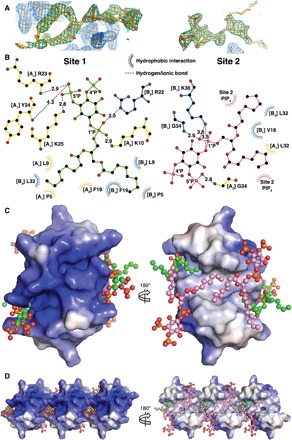
Fig. 3. Molecular details of PIP2 binding and electrostatic surface of HBD-2–PIP2 complex.

(A) Omit maps of the PIP2 binding sites. The maps were generated by rerunning the final structure refinement with both lipid molecules removed from the model. The Fo-Fc maps are contoured in PyMOL at 2 sigma (green), while the 2Fo-Fc maps are contoured at 1 sigma (blue). The 2Fo-Fc maps around the PIP2 molecules are omitted for clarity. (B) Schematic representation of PIP2 site 1 (left) and site 2 (right). Residues near the binding site are depicted as sticks and dashed lines for ionic and hydrogen bonds and as eyelashes for hydrophobic interactions. (C) Qualitative electrostatic surface representation (blue is positive charge, red is negative charge, and white is uncharged or hydrophobic) of the HBD-2–PIP2 dimer form viewed from the top (left) and from the bottom (right). PIP2 molecules are shown as balls and sticks, with oxygen in red, phosphorus in orange, and carbon in green for site 1 and in pink for site 2. (D) Qualitative electrostatic surface representation of three dimers in the crystal, depicted as in (B), highlighting the site 1 binding pocket (left) and the continuous hydrophobic network of site 2 PIP2 molecules (right).
