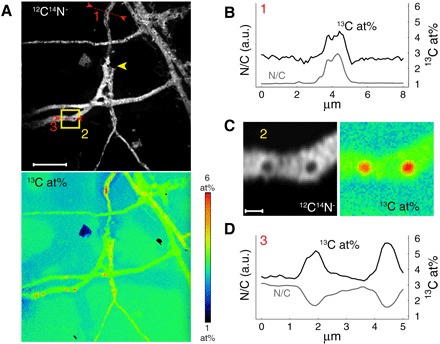
Fig. 4. NanoSIMS images acquired after extended sputter erosion of the PB*AT film shown also in Fig. 3.

(A) Distribution of 12C14N− ion signal intensity (top) and the 13C content expressed as 13C/(12C + 13C) in at% (bottom). Scale bar, 10 μm. Yellow arrowhead indicates burrowed hypha. (B and D) Line scan analyses 1 (B) and 3 (D) of selected hyphae with respect to 13C content and relative nitrogen content (N/C ratio as inferred from C2− normalized C14N− signal intensities; see Materials and Methods for details). The positions of the line scans are shown in (A). (C) Zoom-in of the region indicated by the yellow square (2) in (A). Scale bar, 1 μm. a.u., arbitrary units.
