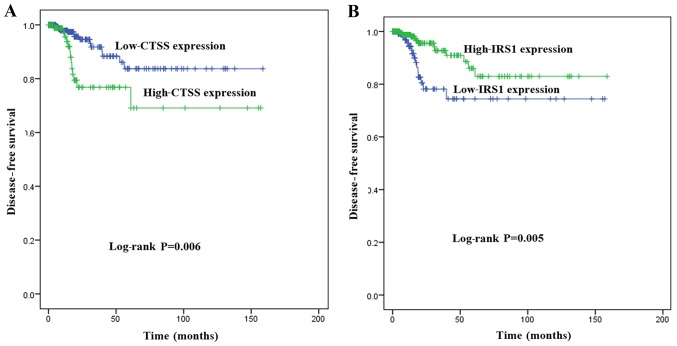
Figure 6.
Kaplan-Meier survival analysis of the association between key gene expression level and DFS. (A) Patients with high expression of CTSS demonstrated significantly shorter DFS than those with low level of CTSS expression (P=0.006). (B) Patients with low expression of IRS1 demonstrated significantly shorter DFS than those with high level of IRS1 expression (P=0.005). Survival curves were compared using log-rank test. DFS, disease-free survival.

