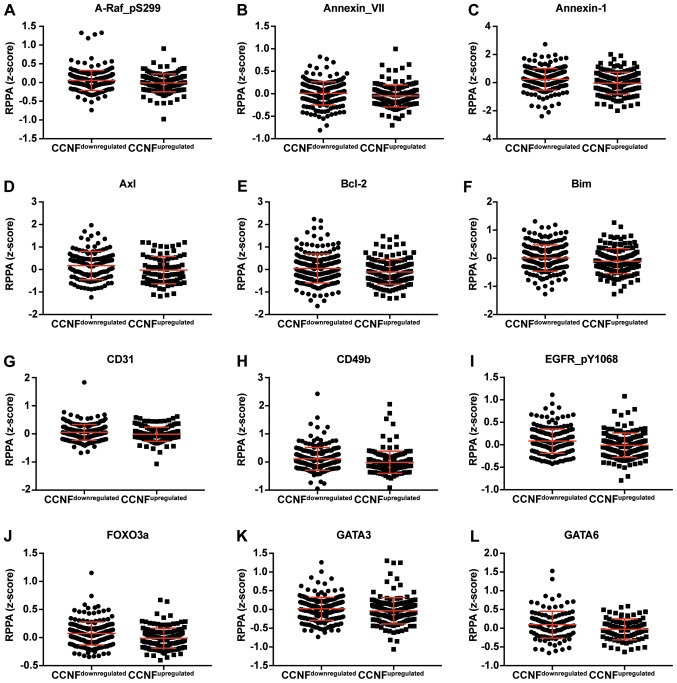
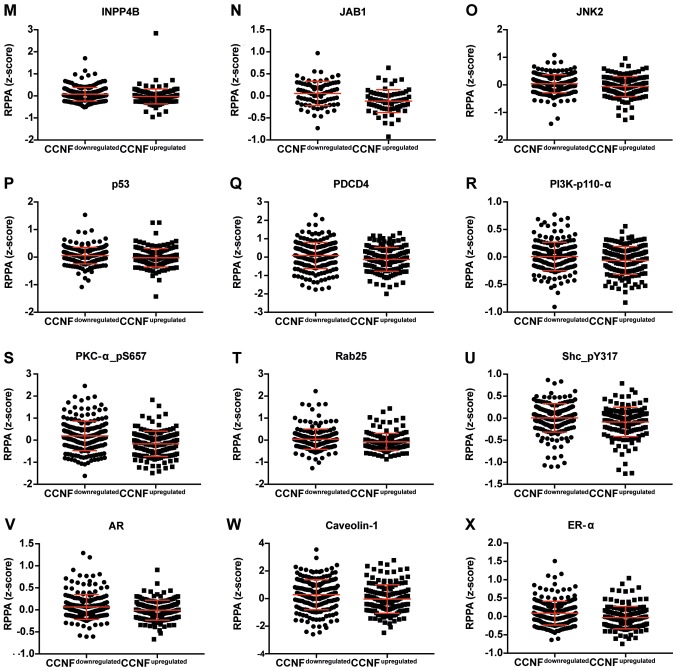
Figure 3.
Dot plot representation of the protein levels by RPPA (z-score). (A-L) Proteins negatively correlated with CCNF mRNA. Horizontal bars represent lower quartile, median and higher quartile. CCNF, cyclin F; RPPA, reverse-phase protein array. Dot plot representation of the protein levels by RPPA (z-score). (M-AA) Proteins negatively correlated with CCNF mRNA. Horizontal bars represent lower quartile, median and higher quartile. CCNF, cyclin F; RPPA, reverse-phase protein array.


