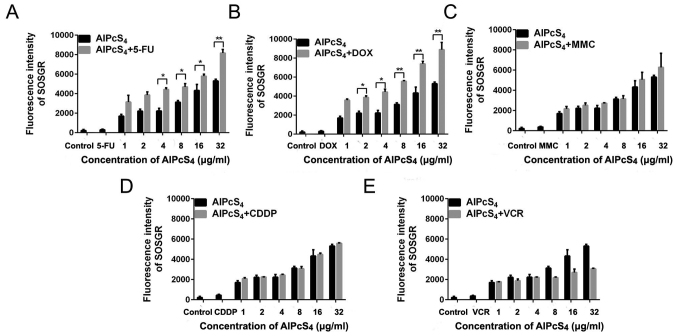
Figure 9.
SOG production in SGC-7901 cells treated with AlPcS4 + 5-FU, AlPcS4 + CDDP, AlPcS4 + DOX, AlPcS4 + MMC, AlPcS4 + VCR and free-AlPcS4. (A-E) Fluorescence intensities of SOSGR probes were measured to analyze SOG in SGC-7901 cells after treatment with 1–32 µm free-AlPcS4. (A) AlPcS4 + 5-FU (20 µm), (B) AlPcS4 + DOX (0.4 µm/ml), (C) AlPcS4 + MMC (0.5 µm/ml), (D) AlPcS4 + CDDP (5 µm) or (E) AlPcS4 + VCR (0.1 µm/ml) and irradiation with 635-nm laser light for 5 min. Data represent the average of three experiments and the bar is the SD. *P<0.05 and **P<0.01 represent a statistically significant difference in the fluorescence intensity of SOSGR in cells between the combination therapy of AlPcS4 with a chemical agent and single therapy of free-AlPcS4. AlPcS4, Al(III) phthalocyanine chloride tetrasulfonic acid; 5-FU, 5-fluorouracil; DOX, doxorubicin; CDDP, cisplatin; MMC, mitomycin C; VCR, vincristine; SOG, singlet oxygen.

