Figure 1.
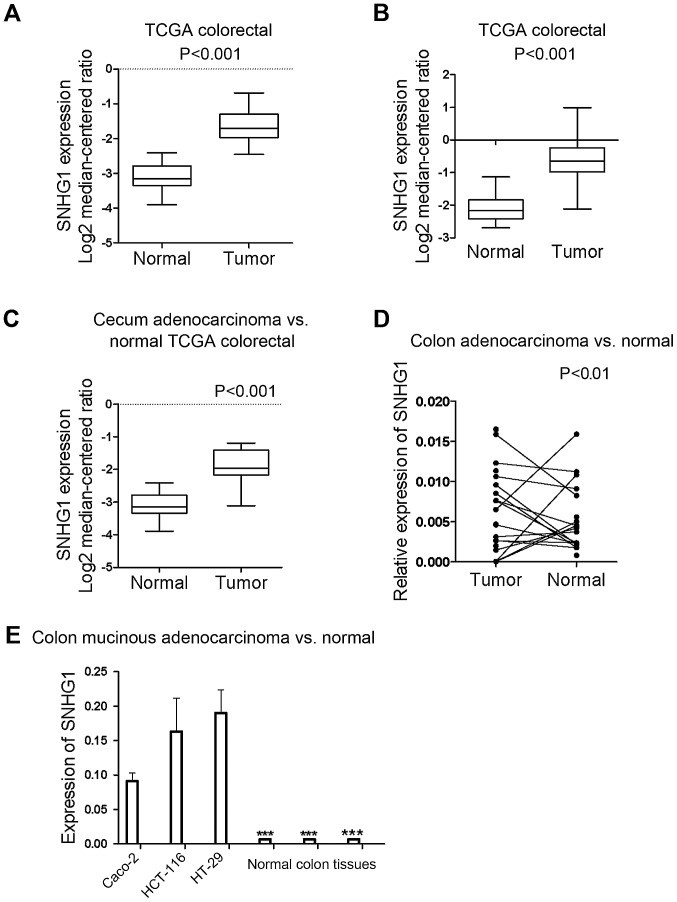
Statistical analysis results of the expression of SNHG1 in 3 datasets obtained from the Oncomine database, and the expression of SNHG1 in 13 pairs of patient tissues and 3 cell lines. (A) TCGA colorectal: cecum adenocarcinoma vs. normal: 2.697-fold (P<0.001); (B) colon adenocarcinoma vs. normal: 2.806-fold (P<0.001); (C) colon mucinous adenocarcinoma vs. normal: 2.241-fold (P<0.001). (D) Except for 2 colon cancer patients, all of the colon cancer cases indicated a significantly higher expression of SNHG1 in cancer tissues compared with adjacent non-cancer tissues (P<0.01). (E) SNHG1 was upregulated in HCT-116, Caco-2, HT-29 cell lines than in human normal colon tissues (***P<0.001).

