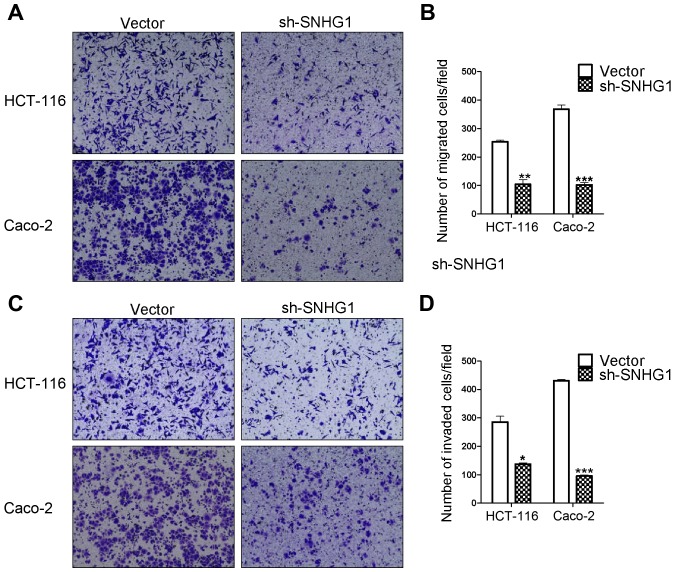
Figure 4.
Transwell® assays of the migration and invasion in Caco-2 and HCT-116 cells. (A) The migration assay in Caco-2 and HCT-116 cells. (B) The statistical analysis of (A). The migration ability in the vector group was higher than that of the sh-SNHG1 group (HCT-116: **P<0.01; Caco-2: ***P<0.001). (C) The invasion assay in Caco-2 and HCT-116 cells. (D) The statistical analysis of (C). The invasion ability in the vector group was higher than that of the sh-SNHG1 group (HCT-116: *P<0.05; Caco-2: ***P<0.001).

