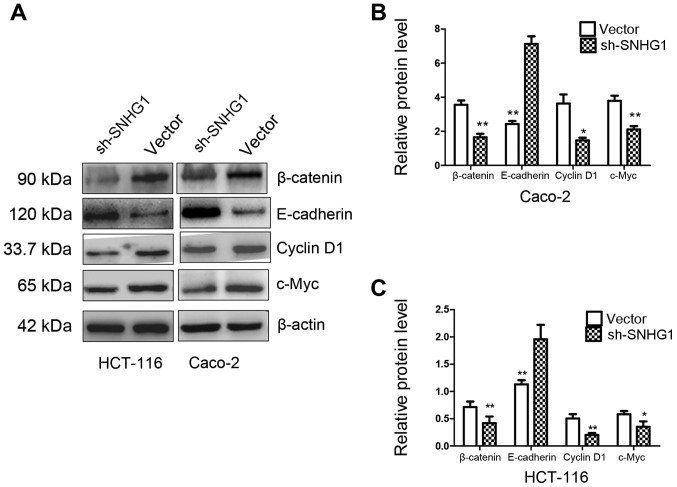
Figure 6.
Western blot analysis of E-cadherin, β-catenin, cyclin D1 and c-Myc protein expression in the sh-SNHG1 group and the vector group. (A) β-catenin, cyclin D1, c-Myc were significantly decreased while E-cadherin was significantly increased in the sh-SNHG1 group compared to the vector goup in HCT-116 and Caco-2 cell lines. (B and C) The statistical quantitative analysis of (A). *P<0.05, **P<0.01.

