Figure 5.
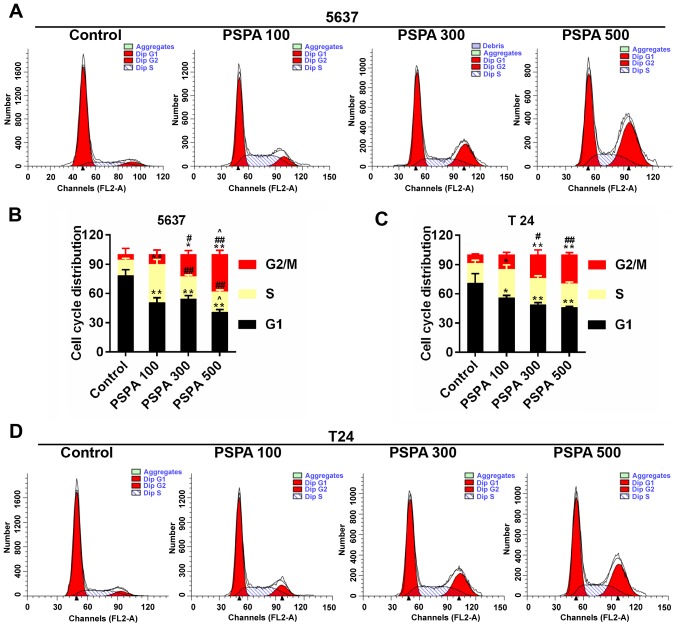
(A and B) Flow cytometry for the estimation of the cell cycle distribution of 5637 cells. (C and D) Cell cycle distribution of T24 cells using flow cytometry assay. Control, BC cells; PSPA 100/300/500 indicated cells treated with 100/300/500 µg/ml PSPA, respectively; *P<0.05, **P<0.01 vs. control; #P<0.05, ##P<0.01 vs. PSPA 100; ^P< 0.05, ^^P< 0.01 vs. PSPA 300.

