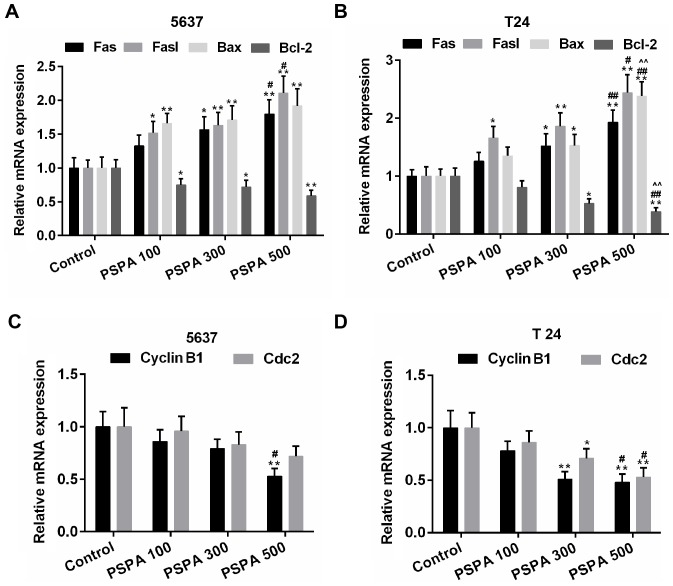
Figure 6.
(A and B) RT-PCR for the quantification of the expression of Fas, Fasl, Bax and Bcl-2 in 5637 (A) and T24 (B) cells. (C and D) RT-PCR for the quantification of the expression of cyclin B1and Cdc2 in 5637 (C) and T24 (D) cells. Control, BC cells; PSPA 100/300/500 indicated cells treated with 100/300/500 µg/ml PSPA, respectively; *P<0.05, **P<0.01 vs. control; #P<0.05, ##P<0.01 vs. PSPA 100; ^P<0.05, ^^P<0.01 vs. PSPA 300.

