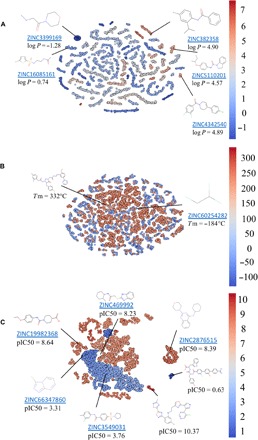
Fig. 7. Clustering of generated molecules by t-SNE.

Molecules are colored on the basis of the predicted properties by the predictive model P, with values shown by the color bar on the right. (A and C) Examples of the generated molecules randomly picked from matches with ZINC database and property values predicted by the predictive model P. (A) Partition coefficient, logP. (B) Melting temperature, Tm (°C); examples show generated molecules with lowest and highest predicted Tm. (C) JAK2 inhibition, predicted pIC50.
