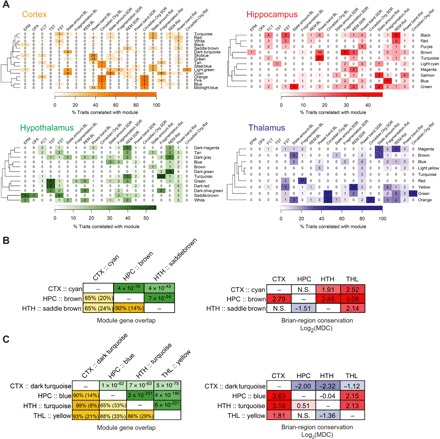
Fig. 3. Functional significance of gene coexpression network modules.

(A) Heat maps describing the relevance of modules (rows) to phenotypic categories (columns). Categories of affective phenotypes included those measured in the elevated plus maze (EPM), open field arena (OFA), fear conditioning test (FCT), tail suspension test (TST), and forced swim test (FST). Sleep phenotypic categories included sleep/wake state amount, sleep fragmentation, REM sleep, EEG power band, and circadian organization measured under undisturbed baseline conditions (BL), as well as the changes in these phenotypes after a 6-hour SD or 1-hour Rst. Only non–eQTL-enriched modules are shown. Heat colors indicate the percentage of phenotypes in a category that are significantly correlated with module eigengene. Numbers in each cell indicate the number of phenotypes in the category that are significantly associated with module eigengene. For clarity, the heat colors for cortex and thalamus are saturated at 60%. (B and C) Organization of myelination network modules (B) and extracellular matrix modules (C) across brain regions. Left: Gene overlap among modules of the same cellular function. The lower triangles of the matrices show the percentage of overlapping genes relative to the size of the smaller module (or relative to the combined size of two modules in parentheses). The upper triangles of the matrices show the P values from Fisher’s exact tests evaluating the enrichment of module in one another. Right: Differential connectivity of modules with the same cellular function across brain regions. Cells were colored according to their values. CTX, cortex; HPC, hippocampus; THL, thalamus; HTH, hypothalamus.
