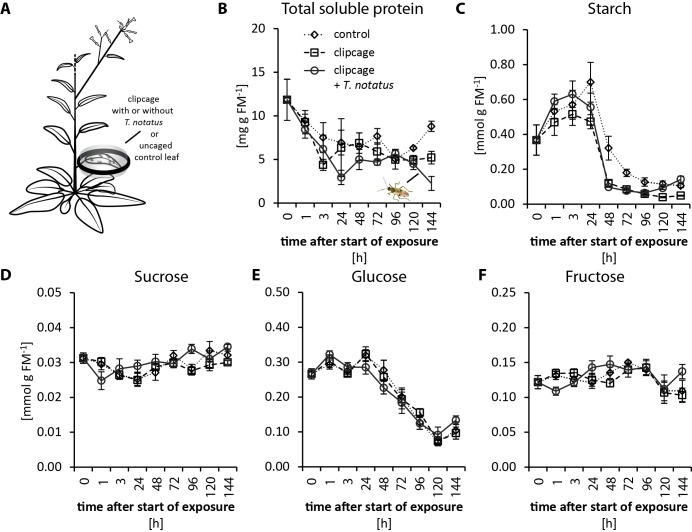
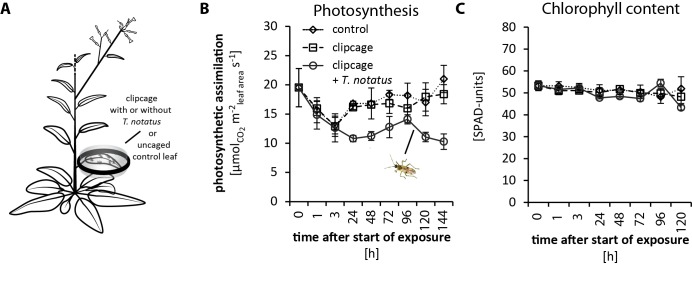
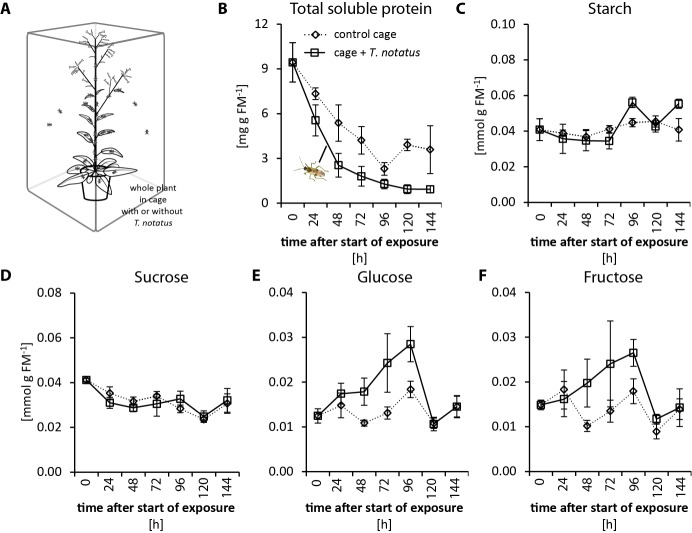
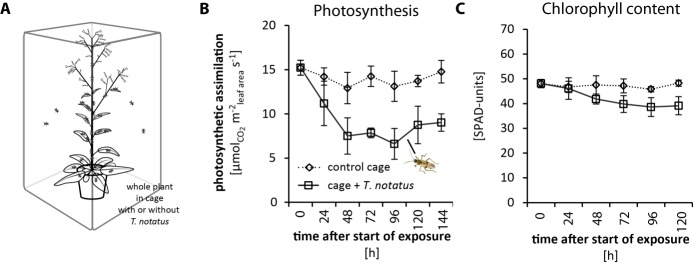
Figure 2. Tupiocoris notatus feeding on single leaves does not significantly change nutrient levels.
(A) Experimental setup: On each plant we enclosed one leaf in a plastic clipcage with (clipcage +T. notatus; solid line) or without (clipcage, dashed line) 20 T. notatus. Additionally, we collected uncaged control leaves (control, dotted line). (B) Total soluble proteins (TSP), (C) starch, (D) sucrose, (E) glucose and (F) fructose were analyzed in a time-kinetic from 1 to 144 hr. Statistically significant differences were identified with ANCOVA with mirid as factor and time as continuous explanatory variable. (B) TSP: log transformed time F1,51 = 14.317, p<0.001; mirid F1,51 = 2.438, p=0.125; time*mirid F1,51 = 0.479, p=0.492. (C) log transformed starch: time F1,51 = 137.376, p<0.001; mirid F1,51 = 3.749, p=0.058; time*mirid F1,51 = 2.651, p=0.110. (D) sucrose: time F1,51 = 13.847, p<0.001; mirid F1,51 = 3.883, p=0.054; time*mirid F1,51 = 5.894, p=0.019. (E) glucose: time F1,51 = 173.06, p<0.001; mirid F1,51 = 0.050, p=0.823; time*mirid F1,51 = 0.107, p=0.745. (F) fructose: log transformed time F1,51 = 0.505, p=0.480; mirid F1,51 = 0.433, p=0.513; time*mirid F1,51 = 5.798, p=0.020. Error bars depict standard errors (N ≥ 3). FM: fresh mass. For raw data see Raw_data_FIGURE_2 (Dryad: Brütting et al., 2018).


