. 2018 Jul 17;7:e36268. doi: 10.7554/eLife.36268

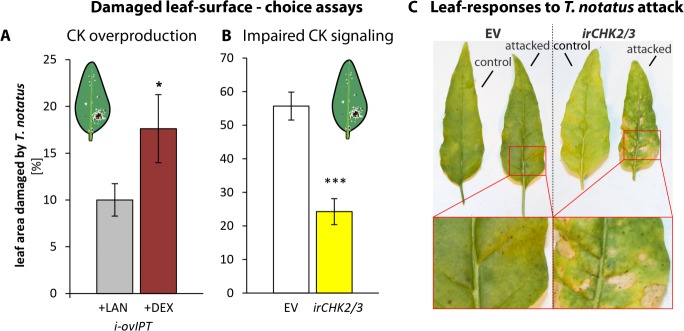
Figure 6. Cytokinin-regulated traits mediate Tupiocoris notatus feeding preferences and alter leaf responses to feeding.

(A) and (B): Surface damage on N. attenuata plants after 10 d of T. notatus feeding. (A) T. notatus could choose between dexamethasone-inducible isopentenyltransferase-overexpressing plants (i-ovipt) treated with dexamethasone-containing lanolin paste (+DEX) or lanolin paste without dexamethasone as control (+LAN; figure based on data from Schäfer et al., 2013). Statistically significant differences were identified with pairwise t-test: N = 7, p=0.032. (B) Choice between empty vector (EV) and irchk2/3 plants silenced in the two cytokinin receptor genes NaCHK2 and NaCHK3 (irchk2/3). Pairwise t-test: N = 6, p<0.001. Error bars depict standard errors. *p<0.05, ***p<0.001. (C) Representative pictures of leaves of EV or irchk2/3 plants with or without T. notatus damage. Magnifications show necrotic lesions occurring only in irchk2/3 plants after several days of mirid feeding. For raw data see Raw_data_FIGURE_6 (Dryad: Brütting et al., 2018).

Figure 6.

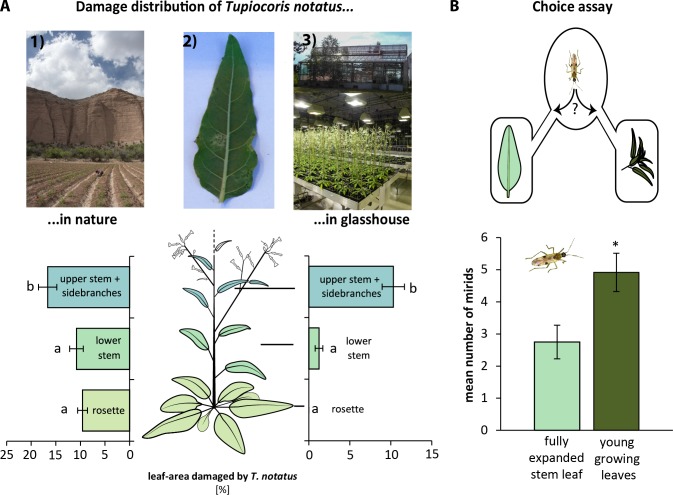
Figure 6—figure supplement 1. Tupiocoris notatus prefers to feed on young leaves.

Figure 6—figure supplement 1.

(A) Distribution of T. notatus damage in flowering Nicotiana attenuata plants grown in the field and glasshouse. Upper panel: picture 1) field plot at Lytle Preserve, Utah, 2) a typically damaged leaf, 3) glasshouse and plants in the glasshouse. Lower panel: Damaged leaf area in % in field and in glasshouse. Leaves were classified as rosette leaves, lower to mid stem leaves and upper stem leaves and side branches as indicated in the schematic drawing (left). One-way ANOVAs followed by Tukey HSD post hoc tests were used to identify statistically significant differences. Field plants: N = 21, F2,33 = 5.729, p=0.007; glasshouse plants: N = 4, F2,9 = 45.5, p<0.001. Different letters indicate significant differences (p<0.01), error bars depict standard errors. (B) Choice assay: 10 mirids were placed in an arena with two tubes connected to either a fully-grown leaf or young growing leaves with an apical stem. Number of mirids on each side was counted after 12 hr. Pairwise t-test: N = 12, p=0.026. Error bars depict standard errors. For raw data see Raw_data_FIGURE_6_S1 (Dryad: Brütting et al., 2018).