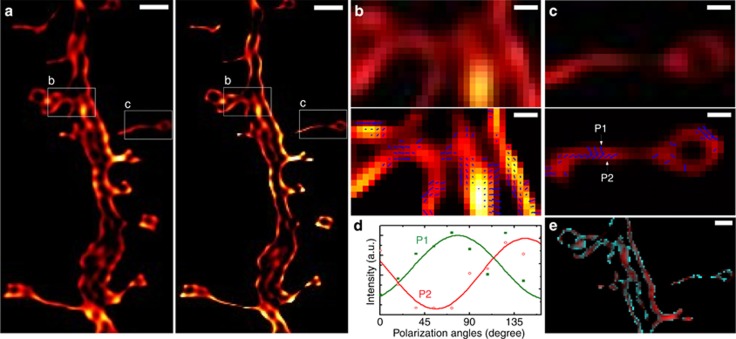
Figure 2.
SPoD and SDOM comparison using the same neuron data set of Ref. 16. (a) Comparison of SPoD (left) and SDOM (right) images of dendritic spine neck in fEGFP membrane-labeled hippocampal neurons. (b,c) A close-up of the orientation mapping of dipoles from the corresponding boxed areas (upper panel, lower panel) in a; the directions of the dipoles are illustrated using arrows. (d) Fluorescence response to the polarization modulation of P1 and P2 in c, showing that these two points are almost perpendicular to each other with respect to dipole orientation. (e) Composite image of OUF (pseudocolor mapped in cyan) and fluorescent intensity data (pseudocolor mapped in red). Scale bar: (a) 1 μm, (b, c) 200 nm, (e) 500 nm.

