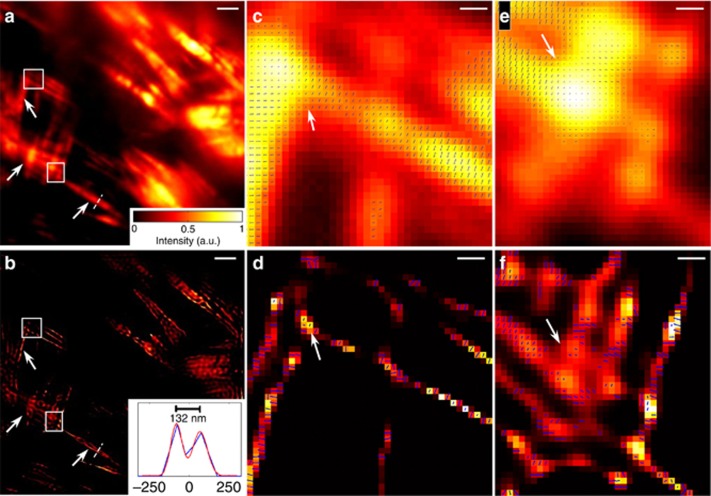
Figure 4.
SDOM imaging of actin in fixed mammalian cells. Wide-field image (a) and SDOM image (b) of Alexa Fluor 568 phalloidin-labeled actin in fixed mouse kidney tissue cells. The diagram in b shows the intensity profile of the corresponding line indicated in a, b. (c, e) are zoomed-in wide-field orientation mapping images and (d, f) are zoomed-in SDOM images. Scale bar: (a, b) 2 μm, (c–f) 200 nm.

