Figure 5.
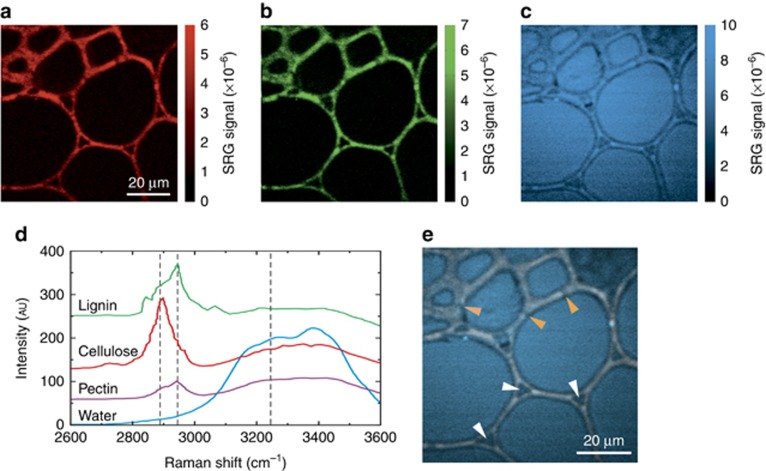
(a–c) SRG images (80 × 80 μm, 400 × 400 pixels) of cells in an cross-sectional area of Abutilon pictum leaf petiole, containing sclerenchyma (upper left area) and parenchyma cells, acquired at 300 μs integration time at pump-Stokes frequency detunings of 2890, 2945, and 3245 cm−1, respectively. (d) Raman spectra, available in the literature, of key compounds present in the plant cells: polysaccharides including cellulose and pectin, polyphenols (lignin), and water. The intensity in the 2800–3000 cm−1 region of the Raman spectrum originates mainly from C–H stretching vibrations, while the intensity in the 3050–3600 cm−1 region mainly stems from O–H stretching vibrations. (e) Overlay image of all three SRG signals. Exemplary sites of intercellular spaces are indicated by white arrowheads, pits, or plasmodesmata by orange arrowheads. Refer to text for details.

