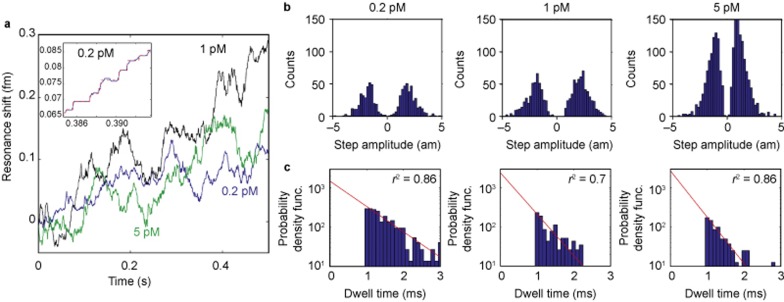
Figure 3.
Individual 2.5 nm radius bead detection. (a) Detection of 2.5 nm radius glass nanoparticles at different concentrations (shown in different colors). Step down events represent the unbinding of particles. A zoom-in of the 0.2 pM case (blue) is shown in the inset. The data were filtered using a median filter and steps were fit (red dashed line) using the step-fitting algorithm of Kerssemakers et al.23 (b) As expected, the mean step amplitude remains constant because the mean particle size does not change. (c) The time in-between binding events (step duration) follows an exponential distribution (red line, fit), indicating that the binding of particles follows a Poisson process. As expected, this exponential distribution shifts to shorter times in a linear fashion with concentration, illustrated here in the log-linear plots as an increase in slope (r2 indicates goodness of fit). In the histograms presented, dwell times faster than the digital low pass filter applied to our data (1 ms) were considered unreliable and were not included in the exponential fit. These results are consistent with single particle binding.

