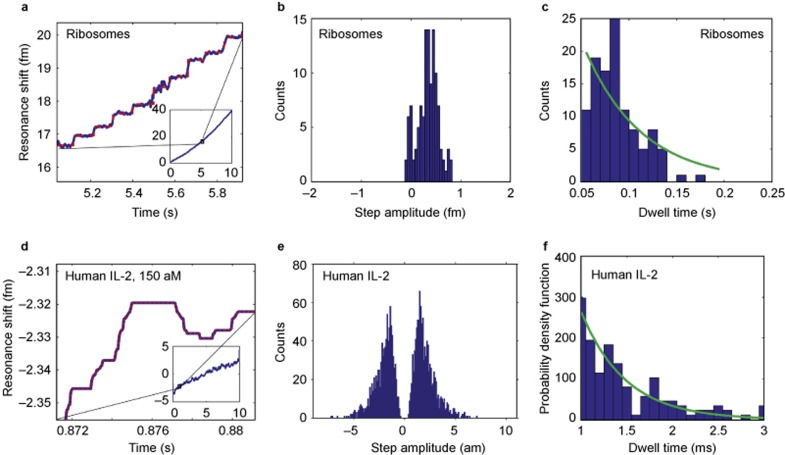
Figure 5.
Individual yeast ribosome (12.5 nm radius) and human interleukin-2 (2 nm radius) detection. (a) The resonant wavelength shift (blue trace) over time of the microtoroid as ribosomes bind to the microtoroid’s surface. The step-fit is shown in red (inset). Zoom-out of the toroid response over the full recording range of 10 s. (b) Histogram of step amplitudes. The maximum step amplitude of 0.8 fm corresponds to a size of 25.6 nm as predicted by our nanoparticle detection data thus suggesting that the binding of individual ribosomes is being observed. Negative step amplitudes correspond to unbinding events. (c) Histogram of the time in between steps (dwell times). As expected for single-particle binding, the dwell time distribution follows an exponential fit (green). (d)–(f) follow the same organization as a–c but with interleukin-2 as opposed to ribosomes.

