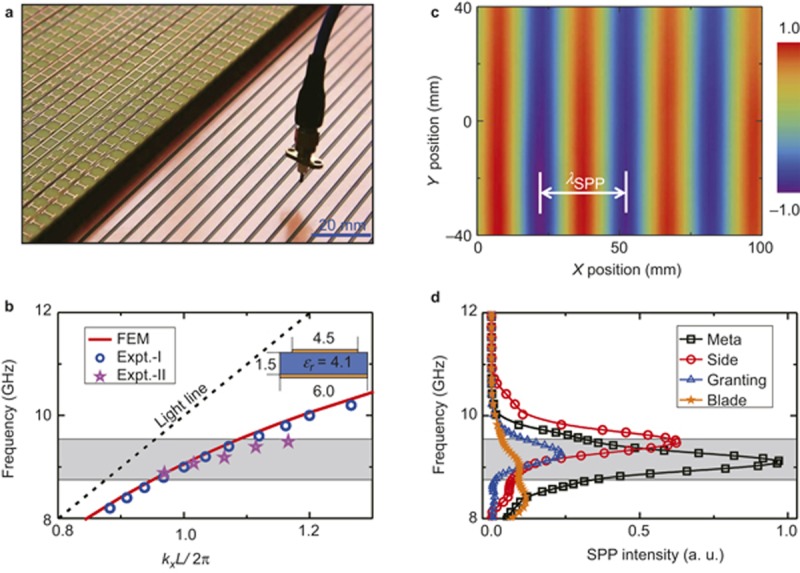
Figure 3.

Near-field characterization of the meta-coupler. (a) Image of part of our experimental setup, in which the fabricated SPP coupler is placed at an optimized distance dc = 10 mm above the ‘plasmonic metal’. A monopole antenna is used to probe the SPP field distribution on the ‘plasmonic metal’. (b) Dispersion relation of the eigen SPP on the ‘plasmonic metal’, obtained via FEM simulations (solid line), direct near-field measurements (open circles) and retrieval from the SPP spectra (solid stars). The inset depicts the unit-cell geometry of the ‘plasmonic metal’, which consists of a metal stripe and a continuous metal separated by a dielectric spacer. All lengths are in units of mm. (c) Experimentally measured Re(Ez) field distribution on part of the ‘plasmonic metal’ when the meta-coupler is illuminated by an input propagating wave with a frequency of 9.2 GHz at an incident angle of θi = 8°. The origin (x = 0 position) is taken to be the point lying 60 mm from the coupler boundary. (d) Measured intensity spectra of the converted SPPs when different SPP couplers are placed at the same distance (10 mm) above the same ‘plasmonic metal’ and illuminated by the same input PW. The shaded region indicates the bandwidth of our meta-coupler, with boundaries defined by the condition that the SPP intensity decays to 1/ e of its maximum value.
