Figure 2.
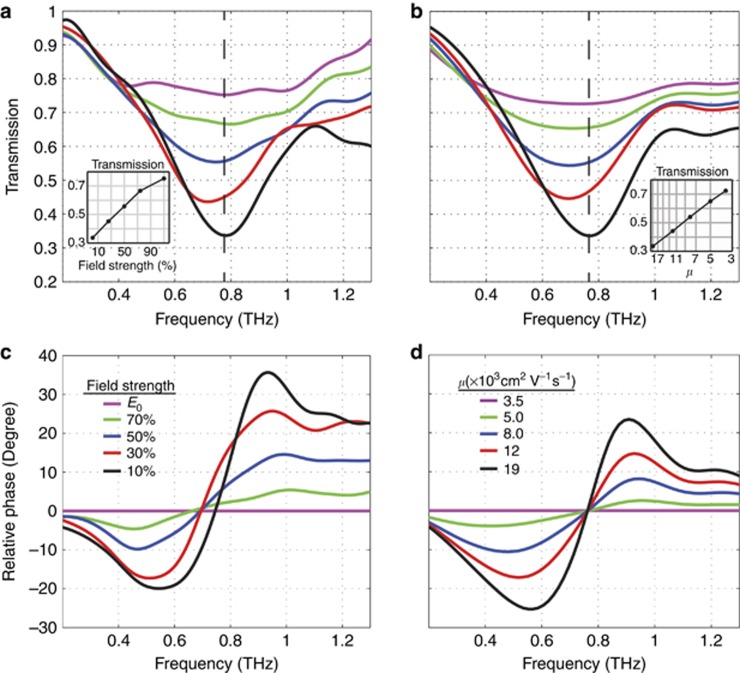
Transmission spectra of the nonlinear PSMM. (a) Measured transmission amplitude of PSMM shown in Figure 1 for various THz field strengths. Inset shows the change in transmission as a function of field strength at the resonance frequency of 0.77 THz. (b) Simulated transmission amplitude as a function of InAs mobility with Nd=1 × 1017 cm−3, μ=3.5 × 10³–1.9 × 104 cm2 V−1 s−1, ε∞=12.25, meff=0.023–0.035. Inset shows the change in transmission as a function of InAs mobility (unit: × 103 cm2 V−1 s−1) at the resonance frequency of 0.77 THz. (c, d) Corresponding measured and simulated transmission phases normalized with respect to the phase at the highest field strength and the lowest electron mobility.

