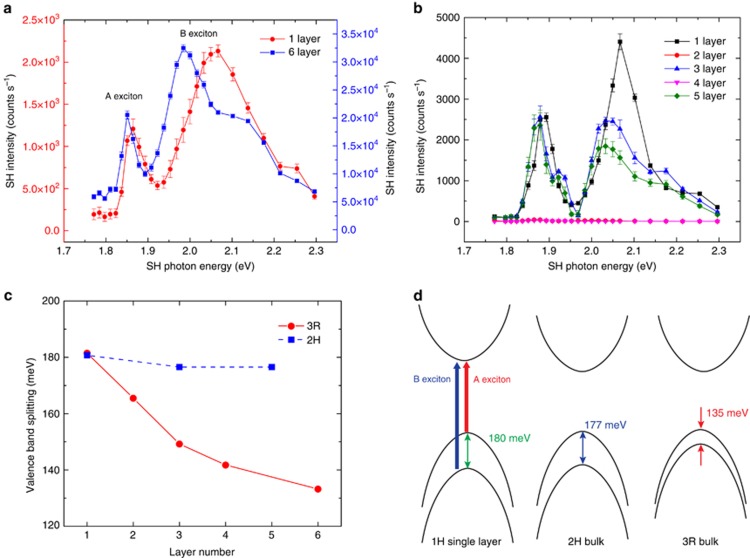
Figure 4.
SH spectroscopy. (a) SH spectra of the 3R-MoS2. The two peaks occurring at around 1.85 and 2.0 eV correspond to the A and B excitons of K-point transitions in MoS2. The six-layer intensity is one order larger than the single-layer intensity. Increasing the layer number decreases both exciton energies, with the B exciton experiencing a much larger shift (roughly 50 meV). (b) SH spectra of the 2H-MoS2, showing a similar response as the 3R crystal. Only odd layers show SH intensities with comparable amplitudes in the layers. The two and four-layered intensities are overlapped. (c) The A and B exciton energy differences, corresponding to the valence-band splitting, of the 3R and 2H crystal are plotted. The 2H exciton splitting remains close to 180 meV up to five layers, while the 3R exciton splitting dramatically decreases to 130 meV at six layers (which agrees to the bulk value obtained from linear absorption). (d) Simplified electronic band structure showing transitions from the valence band to the excitonic band, derived from the SH spectroscopy data at the K-point of the single layer and bulk 2H and 3R phases. The energy of the A exciton decreases from single layer to bulk in both crystal phases by around 10 meV (exemplified in a lower excitonic band of the bulk crystals), however the valence-band splitting is dramatically different, which effects the large difference between the B exciton energy in the two phases. This splitting difference is due to the different stacking geometries and suppressed-interlayer hopping, resulting in an inequality of the electrostatic potential energy at the MoS2 prisms in the two layers.

