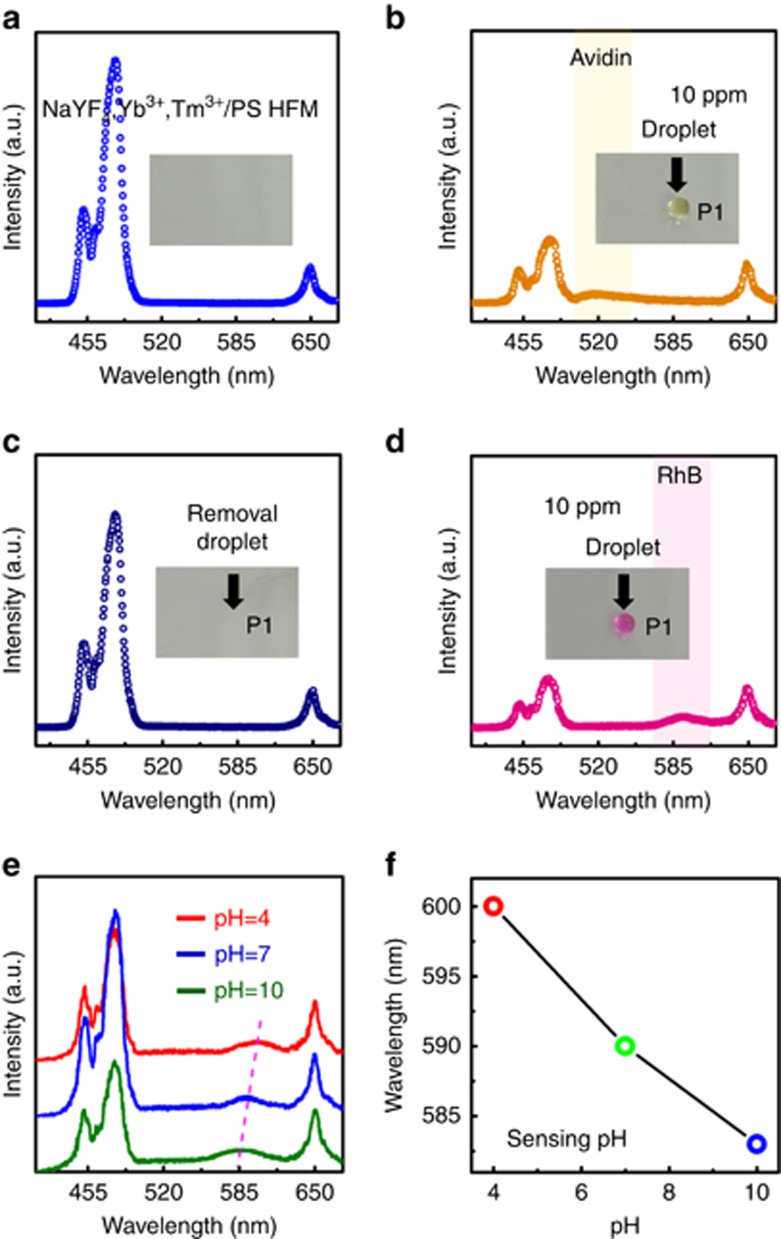
Figure 4.
In situ UC emission spectra and the corresponding optical image of (a) the NaYF4:Yb3+, Tm3+/PS HFM; (b) the NaYF4:Yb3+, Tm3+/PS HFM loaded with a single avidin droplet; (c) the NaYF4:Yb3+, Tm3+/PS HFM after removal of the above avidin droplet via pipette and (d) the NaYF4:Yb3+, Tm3+/PS HFM loaded with a single RhB droplet; (e) spectral evolution on the normalized UC emission of the NaYF4:Yb3+, Tm3+/PS HFM loaded with RhB droplets at different pHs; (f) the emission peak positions of RhB versus the corresponding pHs changes in the RhB droplet.

