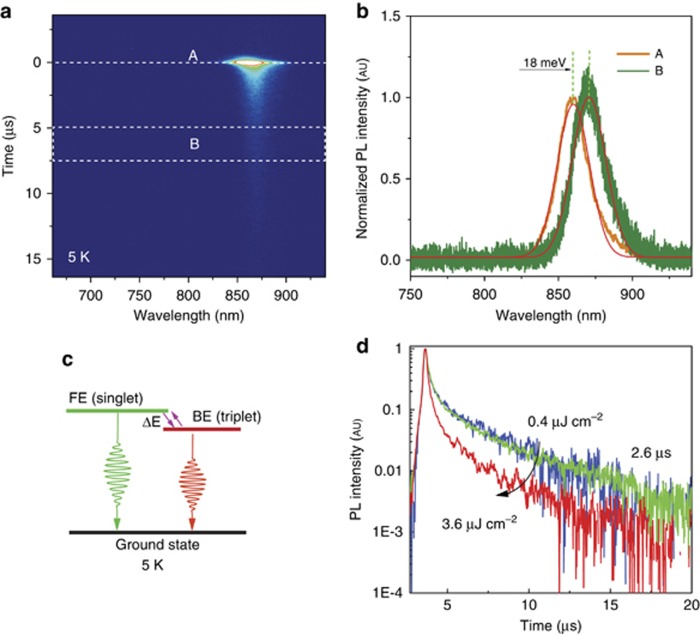
Figure 5.
(a) Streak camera data showing the time-resolved PL emission at 5 K. (b) PL spectra (with Gaussian fit) taken at different time delays after excitation. A is the PL spectrum at time=0; B is the PL spectrum taken from 5 to 7.5 μs. (c) Proposed energy level diagram for FAPbI3 perovskite at 5 K, involving a FE and a BE. (d) Power dependence of the time-resolved PL curve. BE, bound exciton; FAPbI3, formamidinium lead iodide; FE, free exciton; PL, photoluminescence.

