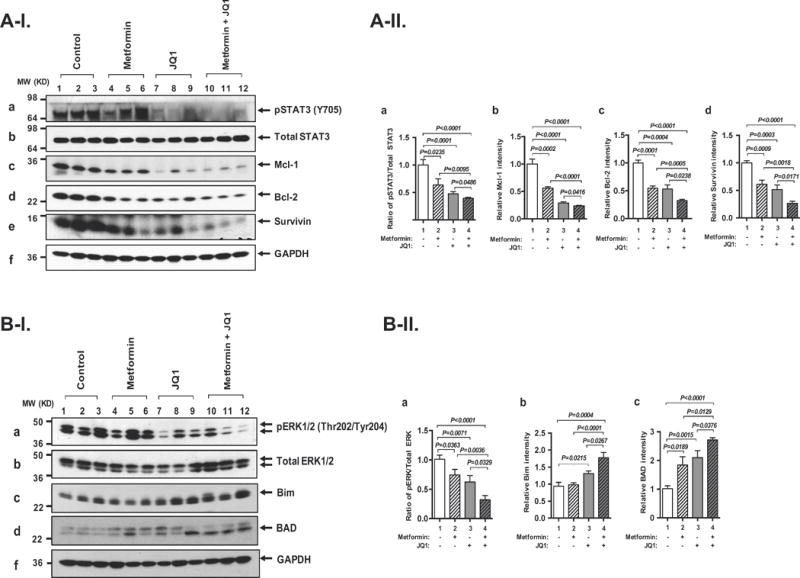
Figure 2. Metformin, JQ1, and combined treatment inhibit STAT3 and ERK1/2 activation in the thyroid tumors of HFD-ThrbPV/PV Pten+/− mice.

(A-I) Western blot analysis for p-STAT3 (Y705) (panel a), total STAT3 (panel b), Mcl-1 (panel c), Bcl-2 (panel d), survivin (panel e), and GAPDH (panel f) in the thyroids of HFD-ThrbPV/PV Pten+/− mice treated with control, metformin, JQ1, or combination treatment, respectively. GAPDH used as a loading control (n=3-6 for each group). (A-II) The band intensities from western blot analysis detected in (A-I) were quantified by Image J analysis. Ratios of p-STAT3 versus total STAT3 (panel a), Mcl-1 (panel b), Bcl-2 (panel c), survivin (panel d). All band intensities were normalized using GAPDH as a loading control. Values are shown as means ± SEM. The p values are indicated. (B-I). Western blot analysis for p-ERK1/2 (Thr202/Tyr204) (panel a), total ERK1/2 (panel b), Bim (panel c), BAD (panel d), and GAPDH (panel e) in the thyroids of HFD-ThrbPV/PV Pten+/− mice treated with control, metformin, JQ1, or combination treatment, respectively. GAPDH used as a loading control (n=3-6 for each group). Values are shown as means ± SEM. (B-II). The band intensities from western blot analysis detected in (B-I) were quantified by Image J analysis. Ratios of p-ERK1/2 versus total ERK1/2 (panel a), Bim (panel b), and BAD (panel c) are indicated. All band intensities were normalized using GAPDH as a loading control. Values are shown as means ± SEM. The p values are indicated. (C-I). Immuno-histochemical analysis for cleaved caspase 3 was carried out in the thyroid sections from the control (panel b), metformin (panel d), JQ1 (panel f), and combined treatment (panel h) of HFD-ThrbPV/PV Pten+/− mice. The representative positively stained cells are marked by arrows. The negative control panels using IgG are shown in the corresponding panels (panel a, c, e, and g). (C-II). The cleaved caspase 3-positively stained cells were quantified as percentage of cleaved caspase 3-positive cells versus total cells. The p values are indicated.
