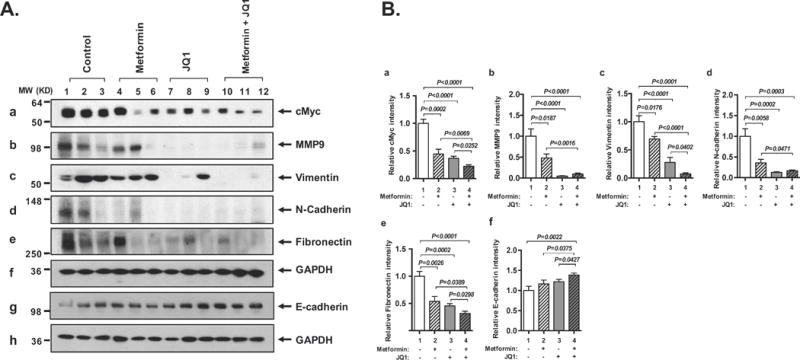
Figure 4. Metformin, JQ1, and combination treatment decrease the expression of key regulators of EMT in the thyroid tumors of HFD-ThrbPV/PV Pten+/− mice.

(A) Western blot analysis for cMyc (panel a), MMP9 (panel b), vimentin (panel c), N-cadherin (panel d), fibronectin (panel e), E-cadherin (panel g), and GAPDH (panel f and h) in the thyroid tumors of HFD-ThrbPV/PV Pten+/− mice treated with vehicle, metformin, JQ1, and combination treatment. GAPDH used as a loading control (n=3 for each group). (B) The band intensities from Western blot analysis detected in (A) were quantified by ImageJ analysis. Relative abundance of cMyc (panel a), MMP9 (panel b), vimentin (panel c), N-cadherin (panel d), and fibronectin (panel e), and E-cadherin (panel f) were calculated using the GAPDH as loading control. The p values are indicated.
