
FIGURE 3.
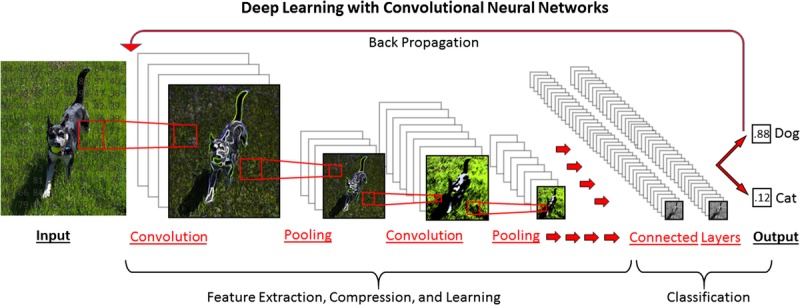
Deep learning schematic with a CNN, designed to classify an input image as either a dog or a cat. The initial digital image is analyzed as a matrix of numerical values corresponding to position and color. This matrix is analyzed through a series of “convolutions” in which filters are applied (sharpening, Gaussian blurring, edge detection etc.) to extract underlying features. Pooling steps compress the data, reducing the features to their base components. After a user-determined number of convolutions and pooling steps have been performed, all of the identified features are combined in “fully connected” layers for final predictive model generation. By a process of “back propagation,” weights of different features are iteratively adjusted to improve prediction when a supervised learning method is used.