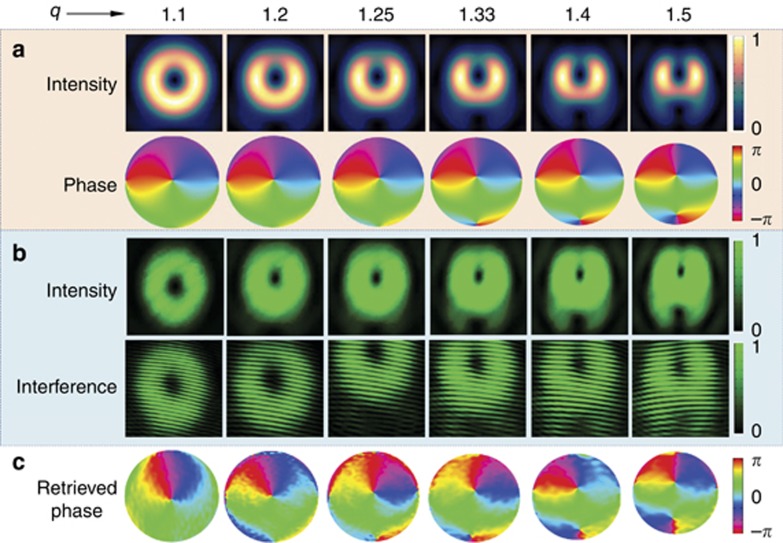
Figure 3.
Optical vortices with fraction q values. (a) Simulated intensity and phase profiles for q=1.1, 1.2, 1.25, 1.33, 1.4 and 1.5, whose Q=0.839, 0.868, 0.884, 0.913, 0.946 and 1.007, respectively. (b) Measured intensity profiles (upper) for the different q values and their corresponding interference patterns (lower) with planar waves. (c) Phase profiles reconstructed from experimental interferences with planar waves.

