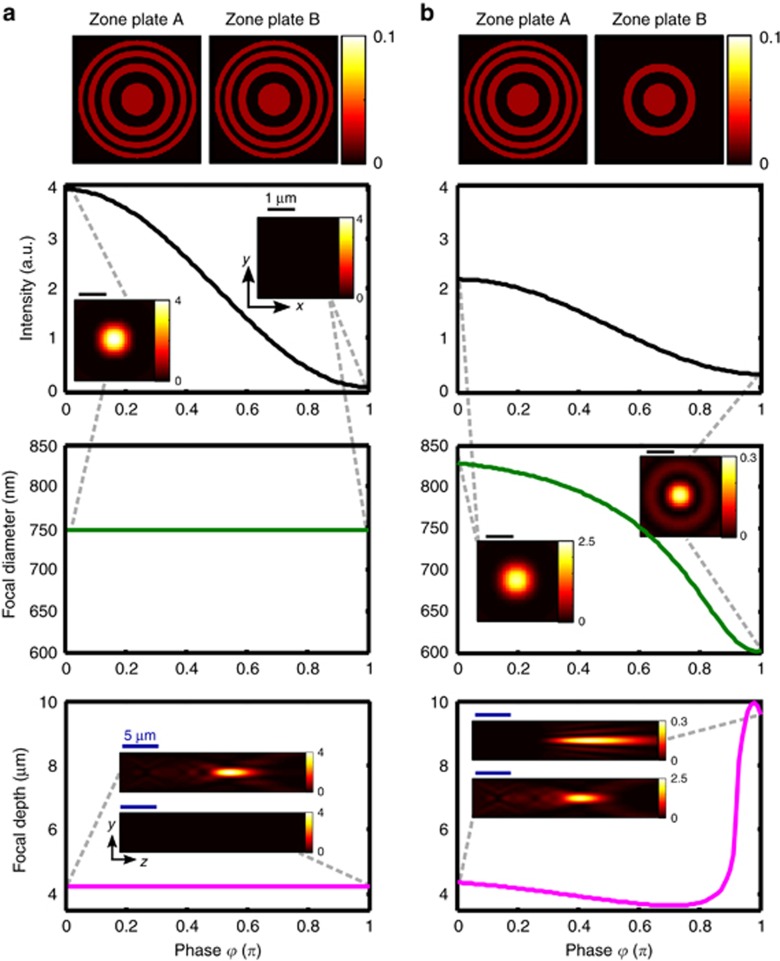
Figure 6.
Simulated phase-dependence of focal properties for interaction of (a) identical Fresnel zone plate patterns (as in Figure 3) and (b) Fresnel zone plate patterns of different size (as in Figure 4) on a beam splitter. The intensity is normalized by the focal intensity produced by lens pattern A alone. Row 1 shows the intensity distribution for each zone plate pattern alone, rows 2 and 3 show the peak intensity and FWHM focal diameter at the nominal focal distance of z=15 μm. Row 4 shows the FWHM focal depth. All color scales show intensity.

