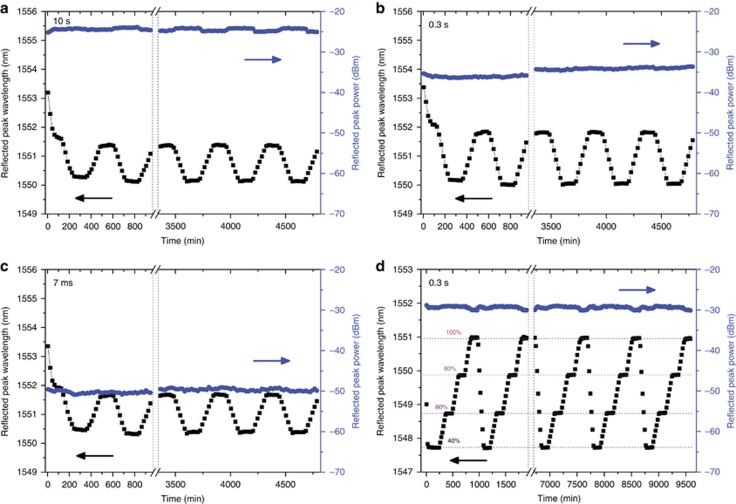
Figure 3.
Wavelength and peak power fluctuations during temperature and humidity cycling. The temperature profile was set between 20 and 50 °C. Each cycle consists of 2 h for stabilization at 20 and 50 °C and 2 h for the increase and decrease between the two temperatures, which totalled 8 h. The results of 10 cycles are recorded for (a) 10 s FBG, (b) 0.2 s FBG and (c) 7 ms FBG. The results for 10 humidity cycles between 40%RH and 100%RH at a constant temperature of 40 °C are shown in d. Each cycle consists of 2 h for stabilization at each humidity level and 2 h for the increase and decrease between the stated levels. For all of the graphs, only the first two and last three cycles are plotted, with the dash line representing the missing cycles.

