Figure 4.
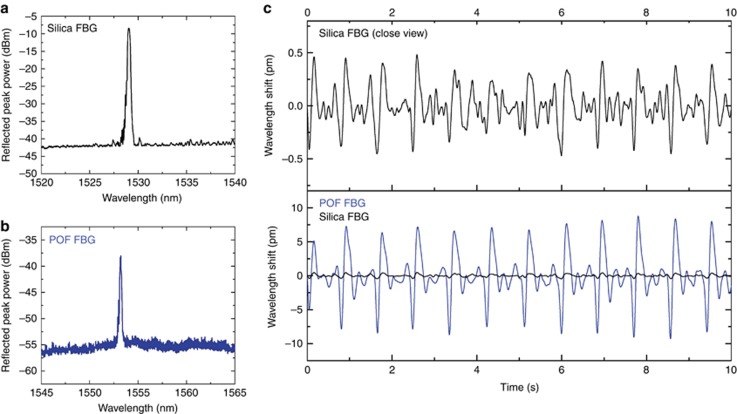
FBG waveforms generated from heartbeat monitoring. (a) Reflection spectrum of the silica FBG used in the experiment. (b) Reflection spectrum of the 7 ms polymer FBG (stabilized for a few months after UV exposure) used in the experiment. (c) Filtered reflection peak wavelength shift of the silica (top) and polymer FBG (bottom).

