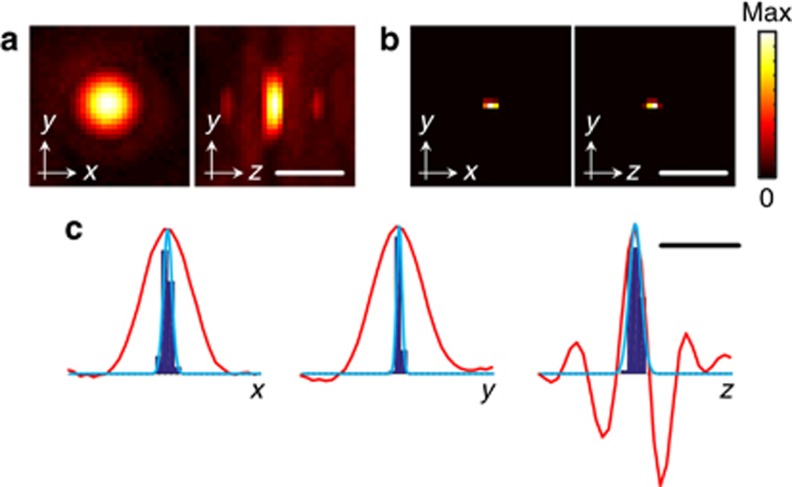
Figure 2.
Localization accuracy. (a) Maximum intensity projections of the three-dimensional optoacoustic image of a 30 μm absorbing microsphere. (b) Equivalent image obtained as the three-dimensional histogram of the localized positions in a sequence of 5000 frames. (c) Normalized histograms of the localized positions in the three Cartesian coordinates (fitted Gaussian curves are shown in blue) along with the corresponding profiles (red curves) of the optoacoustic image in a. Scalebar 400 μm.

