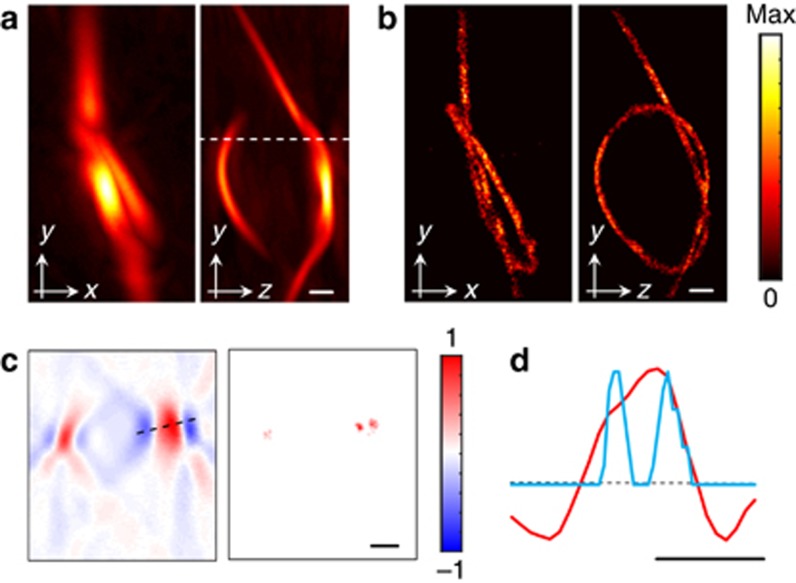
Figure 3.
Resolution enhancement in localization optoacoustic tomography. (a) Maximum intensity projections of the three-dimensional optoacoustic image of a ~220 μm diameter pipette tip bent to form a knot and filled with ink. (b) Equivalent images obtained by localizing the positions of 3600 flowing 30 μm absorbing microspheres. (c) Comparison of the cross-sections marked in a for the standard optoacoustic image (left) and the localization optoacoustic image (right). (d) Comparison of the profiles marked in c for the standard optoacoustic image (red) and the localization optoacoustic image (blue). Scalebar 600 μm.

