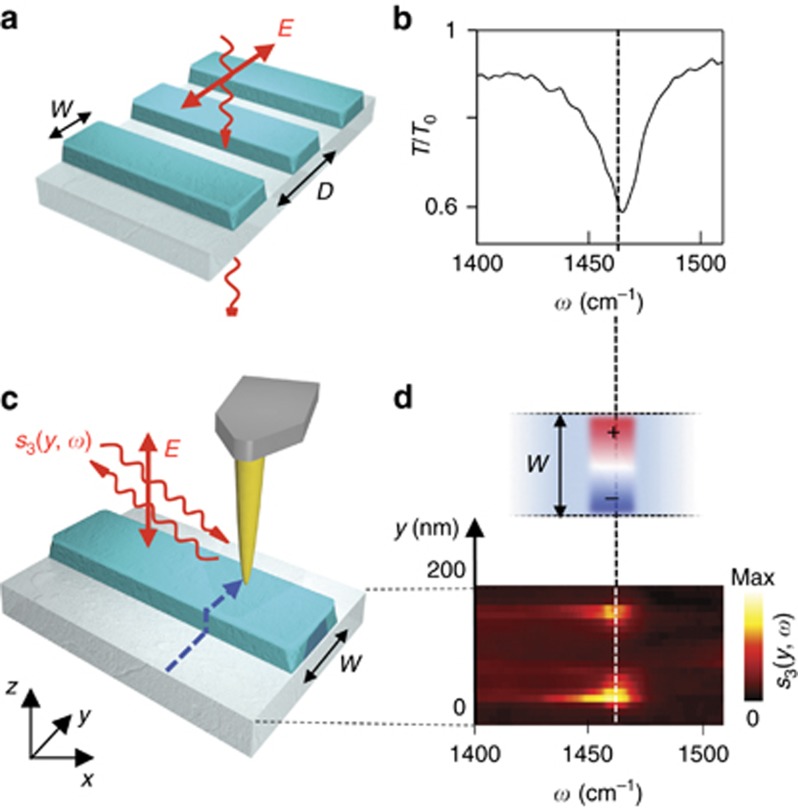
Figure 2.
Far- and near-field spectroscopic characterization of h-BN ribbon arrays. (a) Sketch of the transmission spectroscopy experiment. Incoming light at normal incidence is polarized perpendicular to the ribbons to excite the HPhP resonance. (b) Transmission spectrum normalized to the bare substrate spectrum, T/T0, for a 20 × 20 μm2 h-BN ribbon array. Ribbon width w=158 nm, ribbon period D=400 nm and ribbon height h=40 nm. (c) Sketch of the nano-FTIR spectroscopy experiment. The near-field probing tip is scanned across (y-direction) the h-BN ribbon in 20-nm steps, as indicated by the dashed blue line. Near-field spectra are recorded as a function of the tip position (the detector signal is demodulated at the third harmonic of the tip tapping frequency, yielding s3(y, ω), as explained in the Materials and methods section). (d) Lower panel: Spectral line scan s3(y, ω), where each horizontal line corresponds to a spectrum recorded at a fixed y-position (vertical axis). Upper panel: Illustration of the real part of the z-component of the electric field (Re[Ez]) profile across the ribbon at the resonance frequency observed in the nano-FTIR spectra (lower panel).

