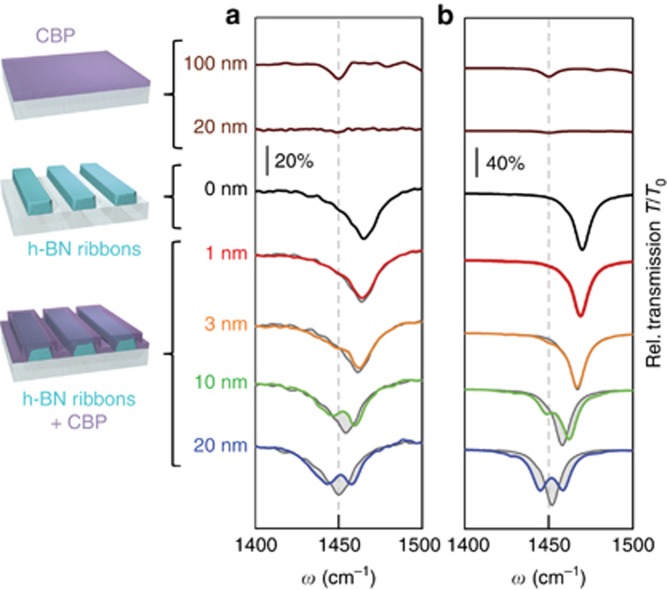
Figure 3.
Infrared transmission spectra of h-BN ribbon arrays with differently thick CBP coating. (a) Experimental transmission spectra of a 20 × 20 μm2 size h-BN ribbon array with period D=400 nm and ribbon width w=158 nm. The thick black curve shows the spectrum of bare h-BN ribbons. As a guide to the eye, it is repeatedly shown (gray cuves, shifted along the frequency axis) in the background of the spectra of the CBP-coated ribbon arrays. Red to blue curves show the spectra of CBP-covered h-BN ribbon arrays for increasing CBP thickness. The brown curves in the upper part of the graph show the spectra of a 100- and a 20-nm-thick bare CBP layer placed directly onto the substrate. (b) Simulated transmission spectra for a bare h-BN ribbon array (black curve, D=400 nm, w=167 nm), for a CBP-covered h-BN ribbon array (same color notation of a) and for a bare CBP layer (brown curves). The calculated spectrum for the bare ribbons is repeatedly shown in the background of the other spectra (gray curves, shifted along the frequency axis). The gray shaded areas visualize the difference between the gray and colored spectra.

